The world is on good track to collapse

· 9 min read
In the 1972 bestselling book Limits to Growth (LtG), the authors (Meadows, Meadows, Randers & Behrens) concluded that if humanity kept pursuing economic growth without regard for environmental costs, global society would experience sharp declines in available food, standards of living, and ultimately the human population, within the 21st century.
The LtG authors used a dynamic systems model, World3, to study key interactions between global variables for population, fertility, mortality, industrial output per capita (p.c.), food p.c., services p.c., nonrenewable resources, and pollution. World3 is based on the work of Forrester (e.g, 1971; 1975), at the time a professor at MIT and the founder of system dynamics: a modelling approach for the interactions between parts of a system, which often produce non-linear behaviour like delays, feedback loops, and exponential growth or decline.
The LtG team generated different scenarios for global developments with World3 by varying assumptions about technological innovation and adoption, amounts of nonrenewable resources, and societal priorities. Some scenarios ended in sharp declines, i.e., a collapse. Collapse in this context did not mean that humankind would cease to exist altogether, just that next generations would be significantly worse off than previous ones. Not all scenarios displayed steep declines; the LtG team identified a set of assumptions that produced a “stabilised world” (SW) scenario in which collapse was avoided and welfare remained high.
However, independent data comparisons since then indicated that the world was still following the “business as usual” (BAU) scenario. This BAU scenario showed a halt in the hitherto continuous increase in global welfare levels around the year 2020 (yes, that’s last year), and collapse setting in around 2030. The last data comparison dated from 2014. That is, until last year when I did mine.
Given the unappealing prospect of societal collapse, I decided to conduct a quantitative comparison between World3 scenarios and empirical data available in 2019. This research was part of my thesis for a Master’s in Sustainability at Harvard University, which I finalized last month. Has humanity done better over recent years, or are we still following the BAU scenario?
The LtG authors published three books between 1972 and 2004, in each of which they studied interactions between the global variables of the World3 model. World3 was updated for each book, so the scenarios varied slightly to moderately in each publication. Previous data comparisons were conducted on the 1972 version of World3. I decided to work with the last World3 version from the LtG book published in 2004 (Meadows, Meadows, & Randers). I chose four scenarios to compare empirical data against: the aforementioned BAU and SW, and the “comprehensive technology” (CT), and “business as usual 2” (BAU2). (Also called scenarios 1, 2, 6, and 9 in the book.)
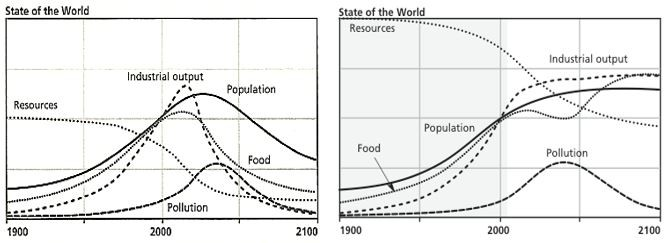
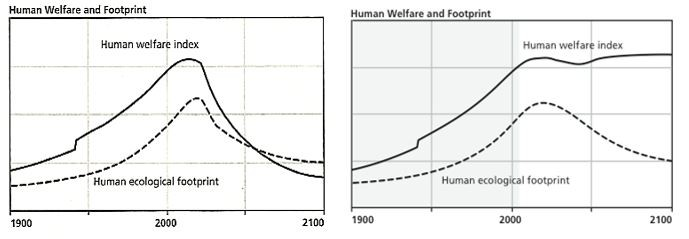
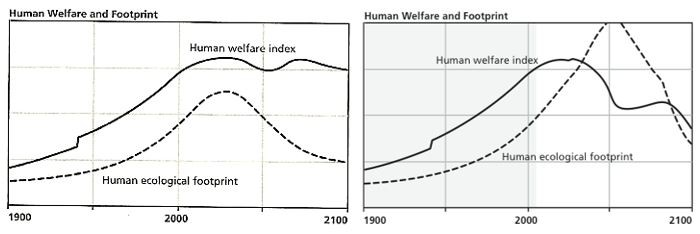
The four scenarios address different “stories”. The BAU scenario was based solely on historic averages without any assumptions. As mentioned, this “business as usual” scenario ends in collapse (Figure 1 and Figure 2). In SW, humanity changes priorities away from material consumption and industrial growth towards health and education services, as well as pollution abatement and resource efficiency technologies. This avoids collapse and leaves humanity with the highest levels of welfare (Figure 1 and Figure 2).
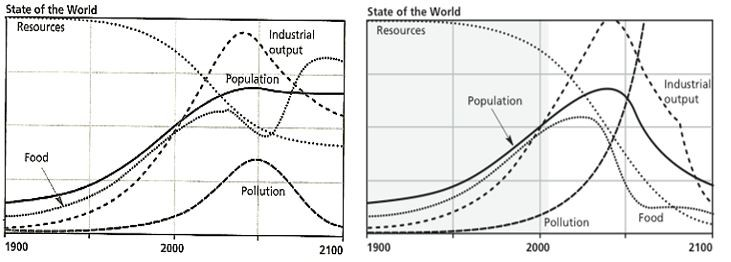
CT represents the technologist’s belief in humanity’s ability to innovate out of environmental constraints. It assumes unprecedented technological innovation in a world that otherwise does not change its priorities much. The new technologies do in fact help avoid an outright collapse. However, CT still depicts some declines (Figure 3) because the technology costs become so high that not enough resources are left for agricultural production and health and education services.
BAU2 assumes double the resources as in BAU. More abundant resources do not avoid a collapse; its cause merely changes from a resource scarcity crisis to a pollution one. With the resource constraint relaxed, incentives to innovate and/or change societal priorities are reduced, so business as usual goes on for longer. This creates so much pollution that agricultural output and human health plummet after some breakpoint (Figure 3). BAU2 essentially tells the story of ecosystem breakdown from accumulated pollution, including from greenhouse gasses (i.e., climate change).
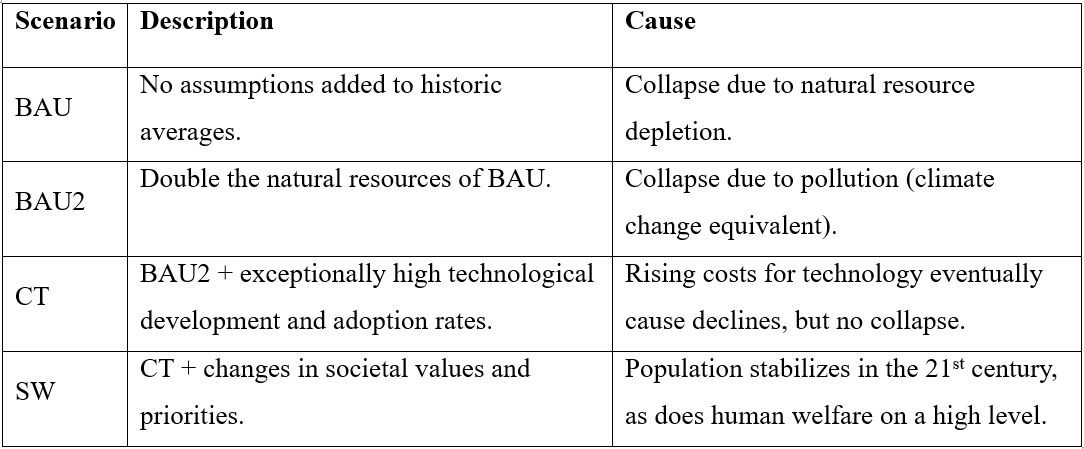
I chose BAU, BAU2, CT, and SW because together they form a comprehensive set. The assumptions underlying each scenario span a range in technological, social, or resource conditions. Additionally, the cause of decline, varying from a temporary dip to societal collapse, differs for each scenario.
I collected data for real-world indicators of the World3 variables population, fertility, mortality, pollution, industrial output, food, services, non-renewable natural resources, human welfare, and ecological footprint. This data came from academia, (non-)government agencies, United Nations entities, and the World Bank. A full description of the data sources can be found in my thesis on the Harvard website.
I plotted the empirical data together with the variable in each of the four scenarios made with the latest version of World3. These plots gave good impressions of the fit, but I also used statistical measures (a normalised root mean square error, and a combination of the value difference and difference in rate of change) to validate what I observed in the graphs.
The graphs for every variable can be found in my thesis, but most show an image similar to the below one (Figure 4): an overall close alignment of empirical data with each of the four scenarios, least closely with SW and most closely with BAU2 and CT.
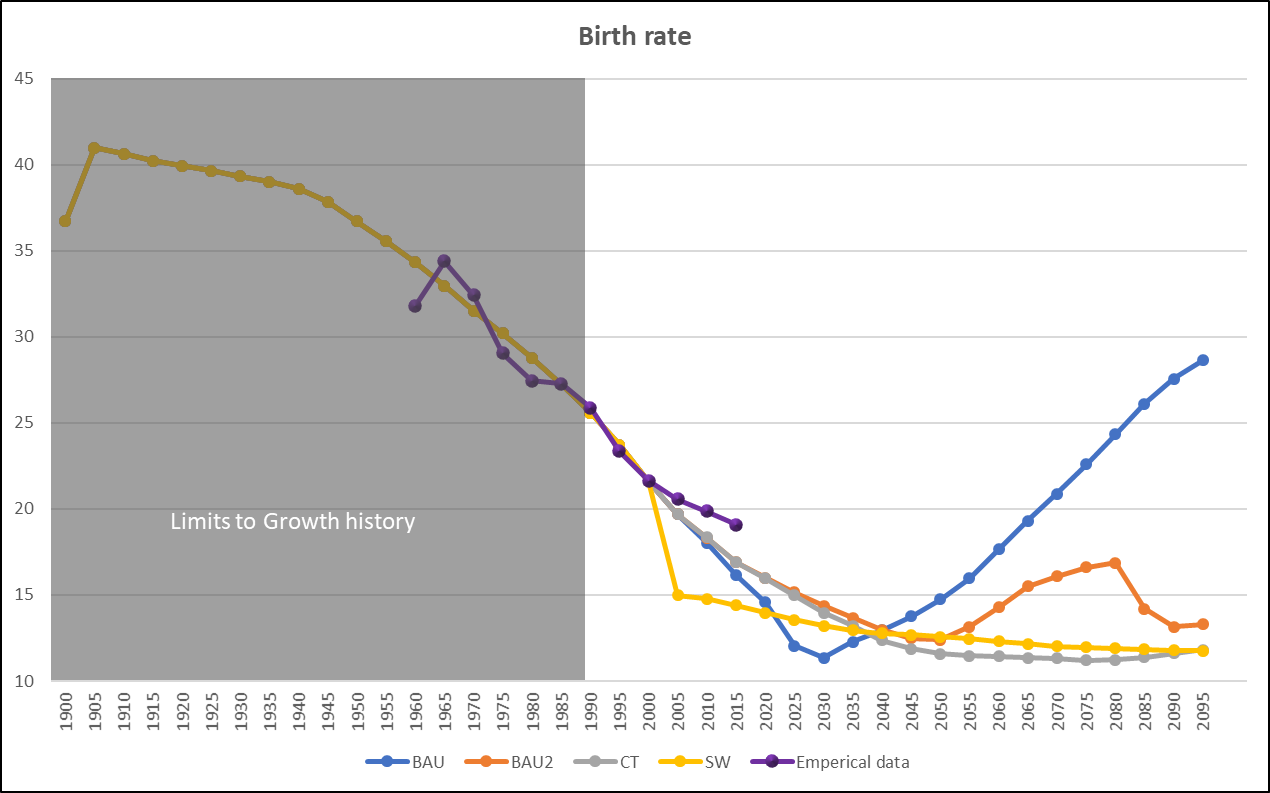
The overall close alignment of empirical data with each of the four scenarios is a testament to the accuracy of World3. It received a lot of criticism at the time, most of it from people misunderstanding the book’s message or the new modelling technique (i.e., system dynamics modelling). But as someone with a Bachelor’s degree in Econometrics and years of work experience in finance and strategic consultancy, I could not tell you another model that has forecast this accurately several decades into the future.
As mentioned, SW was followed least closely. Both BAU2 and CT aligned closest, and BAU scored in between. Thus, unlike in previous research, BAU is no longer the scenario that’s followed closest.
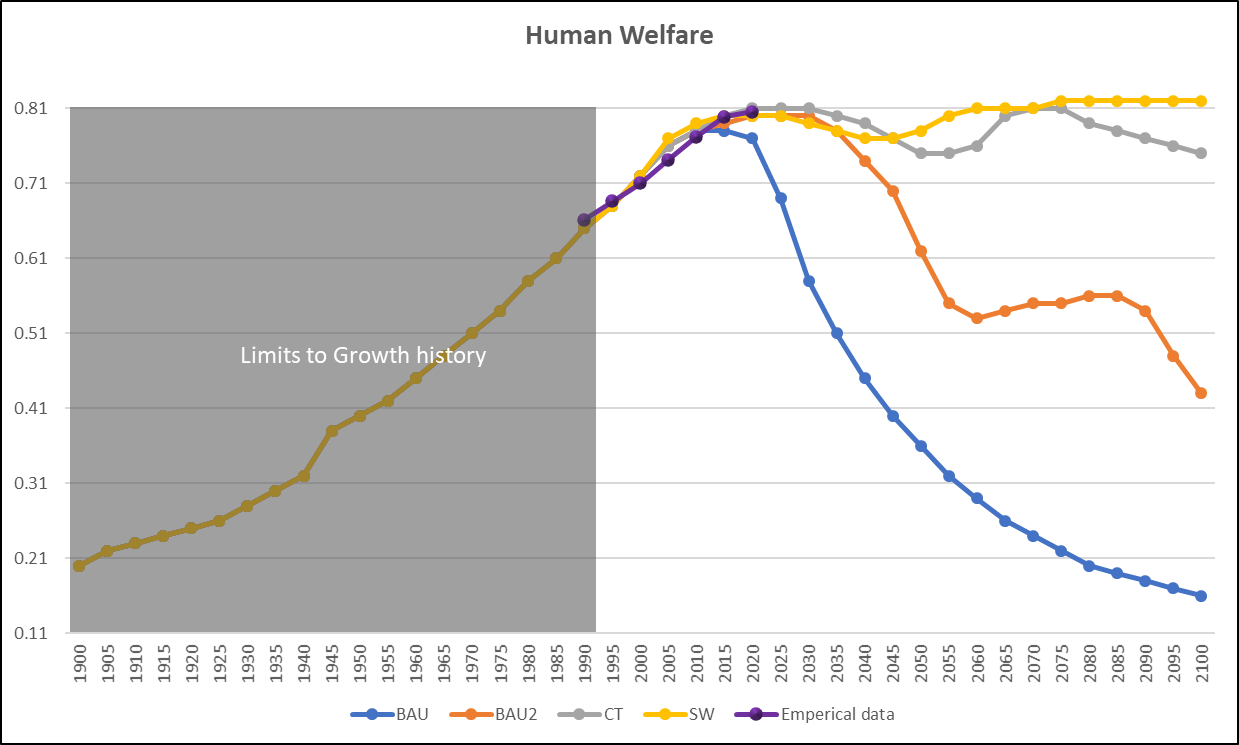
I should note that for several variables the scenarios only diverge significantly after 2020 (as is the case in the above graph, Figure 4). This is especially so for BAU2 and CT, which is why it was not possible to differentiate between them. It’s thus unclear whether a future decline in human welfare can be expected to be moderate as in CT, or sharp like in BAU2 (see Figure 5). Both scenarios however do indicate society will see a halt in industrial, agricultural, and welfare growth in the near to medium term.
An update of this comparison in another few years might be able to identify one specific closest fit to empirical data. Without major changes in societal priorities, this is unlikely to be the scenario showing a sustainable path; the SW scenario, in which a decline in human welfare within this century is minimized (Figure 2), aligned with the data the least.
The BAU not being the closest fit scenario does not mean that societal collapse can be ruled out. The scenario that depicts the smallest declines, SW, is also the one that aligned least closely with empirical data. Furthermore, one of the best fit scenarios, BAU2, shows a collapse pattern. The other best fit scenario however, CT, shows only a moderate decline. Both scenarios show a slowdown in industrial and agricultural output. My research results at this point thus indicate that we can expect a halt in economic growth within the next two decades, whether we consider that a good thing or not. (Indeed, as the informed reader knows, economists and organizations like the IMF have been pointing out recently that we’re seeing a “synchronized slowdown in global growth“.) The strongest conclusion that can be drawn from my research therefore, is that humanity is on a path to having limits to growth imposed on itself rather than consciously choosing its own. However, my research results also leave open whether the subsequent declines in industrial and agricultural output will lead to sharp declines in population and welfare levels.
If you’re thinking that we can bet humanity is following the CT scenario and we’ll basically be fine with only a temporary dip in welfare levels around 2050, you should know that the assumptions underlying CT are highly optimistic given historic figures. But I intentionally avoid delving into the details here of why I think the CT scenario is unrealistic, because it would obscure the question we really should be asking: do we want to be following the CT scenario in the first place?
Why would we use our innovative powers to invent robot pollinators to replace the bees, if we also have the choice to invent agricultural practices that do not have the side effect of insecticide? Why use drones to plant new trees, when we could also restructure our economy so that existing forests are not cut and burned down? Now that humanity has attained global reach and unprecedented power to shape its destiny, limits to growth force upon us the question: who do we want to be and what world do we want to live in?
We can choose different societal priorities for other reasons than looming collapse. Moreover, the possibility that collapse will not happen does not mean that humanity should not choose a more sustainable path. The LtG graphs show how society would be more stable in the SW scenario, but not how much more its citizens and their natural surroundings would be thriving. We don’t have to settle for CT as a best-case scenario.
The close alignment to empirical data and the fact that the scenarios have not diverged much yet, together form a call to action. Hidden behind a seemingly ambiguous outcome of two best fit scenarios that marginally align closer than the other two, hails the message that it’s not yet too late for humankind to change course and alter the trajectory of future data points. We have another choice. Although SW tracks least closely, a deliberate trajectory change is still possible. That window of opportunity is closing fast.
illuminem Voices is a democratic space presenting the thoughts and opinions of leading Energy & Sustainability writers, their opinions do not necessarily represent those of illuminem.
illuminem briefings

Corporate Sustainability · Water
illuminem briefings

Ethical Governance · Environmental Sustainability
Yury Erofeev

Pollution · Water
Vatican News

Ethical Governance · Environmental Sustainability
The Guardian

Climate Change · Environmental Sustainability
World Economic Forum

Carbon Capture & Storage · Carbon