The 10 great challenges facing variable renewable energy

· 24 min read
Most green activists share a beautiful dream where cheap and abundant wind and solar energy mercilessly sweeps aside dirty fossil fuels. And the last decade brought plenty to cheer about.
So, is the green dream finally coming true?
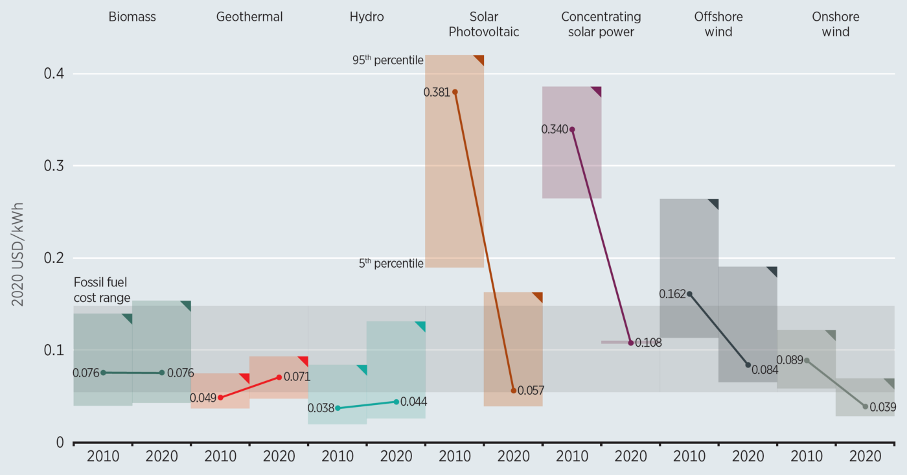
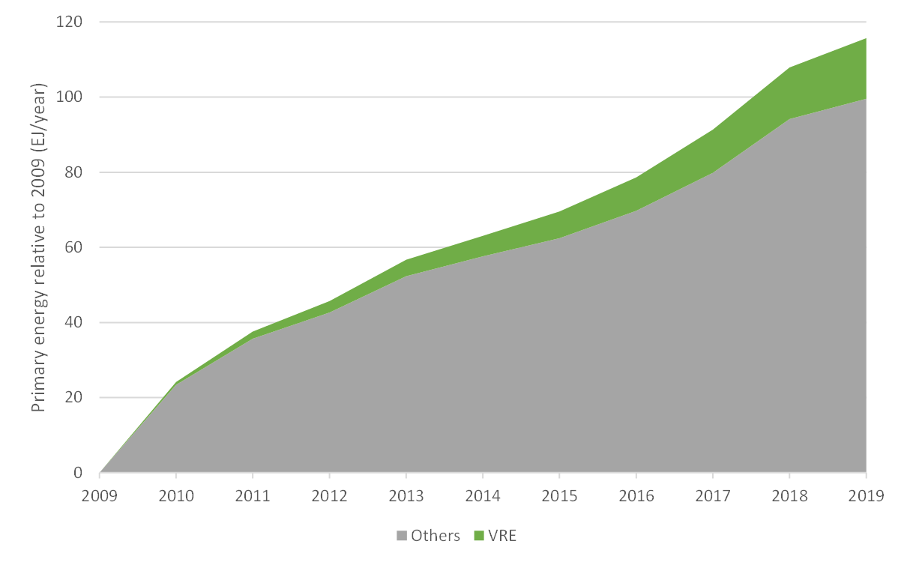
Unfortunately, not quite. After all these spectacular cost declines, variable renewable energy (VRE) generators still account for only about a quarter of primary energy growth (see the graph below), despite strong policy support. Why is that? Well, although more VRE deployment leads to technological learning, it also brings a host of challenges. These two conflicting forces will shape the VRE story going forward.
It’s a classic “receding horizons” scenario: Despite continuous progress, that magical moment when renewables finally put an end to fossil fuels just stays up ahead on the horizon. Two main factors are at play:
Understanding these challenges is key to successfully addressing our great 21st-century sustainability challenge: Give every world citizen a fair shot at a decent life without destroying the ecological carrying capacity of our planet. Let’s dive right in.
The first and best-known challenge of VRE generators is that they only work when the wind blows or the sun shines. In other words, they are variable and non-dispatchable, making their electricity considerably less valuable than conventional sources.
Furthermore, as renewable values fall, the value of dispatchable generators rises. For example, if the VRE market share reaches 50% and their value falls to 50% of the mean, competing conventional generators must have a value of 150% of the mean — triple that of wind and solar.
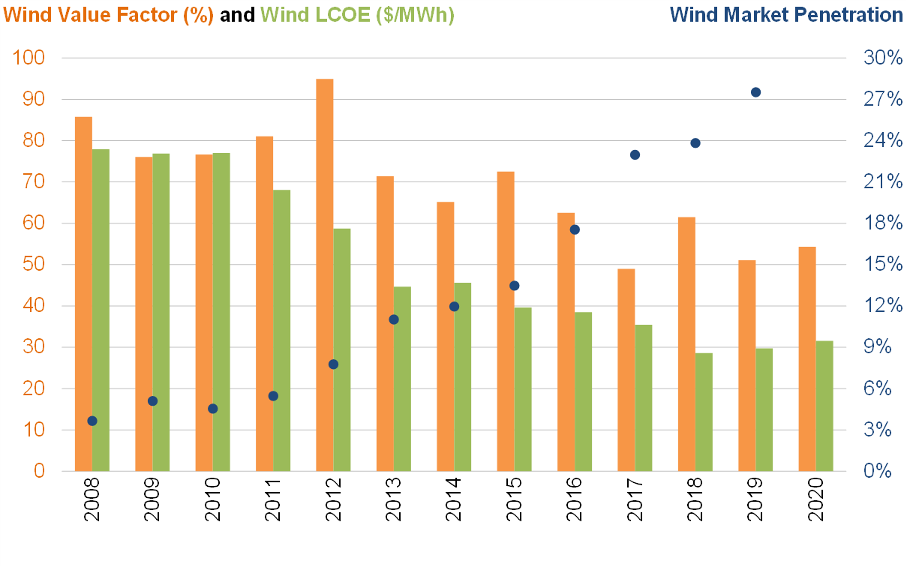
That is part of the reason why large historical cost declines are still not enough to drive wind and solar deployment without policy support. As an example, the graph below shows the evolution of solar PV costs and value in California, where outstanding solar resources that are well aligned with seasonal demand give value factors well above 100% at low market shares.
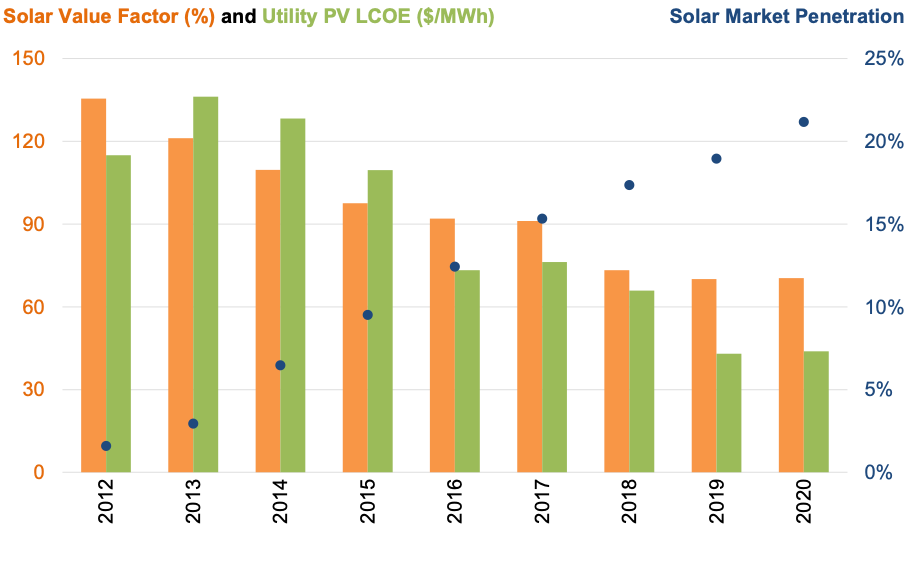
From 2012 to 2020, the cost of utility-scale solar in California declined spectacularly from 115 to 44 $/MWh (62% reduction), but value declines were equally spectacular: 57 to 25 $/MWh (56% reduction). Also, the value decline applies to all solar on the grid, whereas the cost decline only benefits new installations. In other words, the expensive solar plants of previous years are also strongly devalued by the installation of new solar. The story is similar for wind in the US central plains (a.k.a. the Saudi Arabia of wind).
All told, the race between VRE cost and value declines is tight even in regions with the best resources. The situation will be worse in most world regions where lower capacity factors lead to more pronounced variability.
Of course, there are many ways to mitigate the value decline of wind and solar, but all of them come at a cost. This will be a recurring theme as we wade through the nine remaining challenges.
High resource quality is a vital factor in VRE competitiveness. A better wind and solar resource not only reduces levelized costs; it also slows value declines by supplying a steadier generation profile. For a broad overview, global maps of wind and solar resources are given below, followed by a map illustrating the distribution of global economic activity.
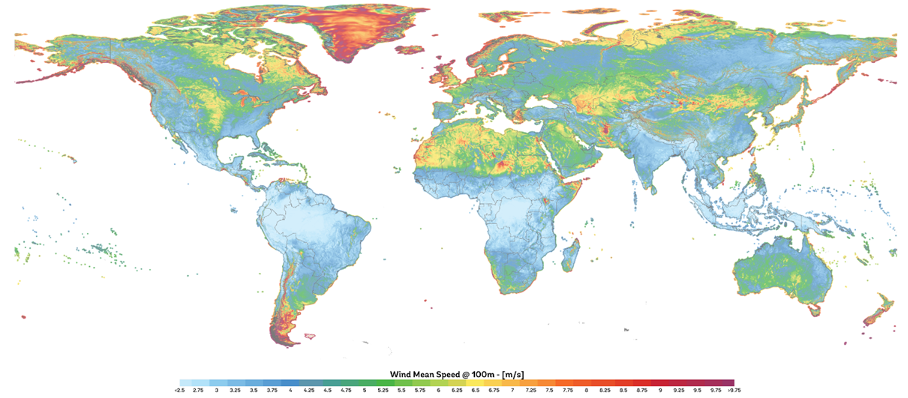
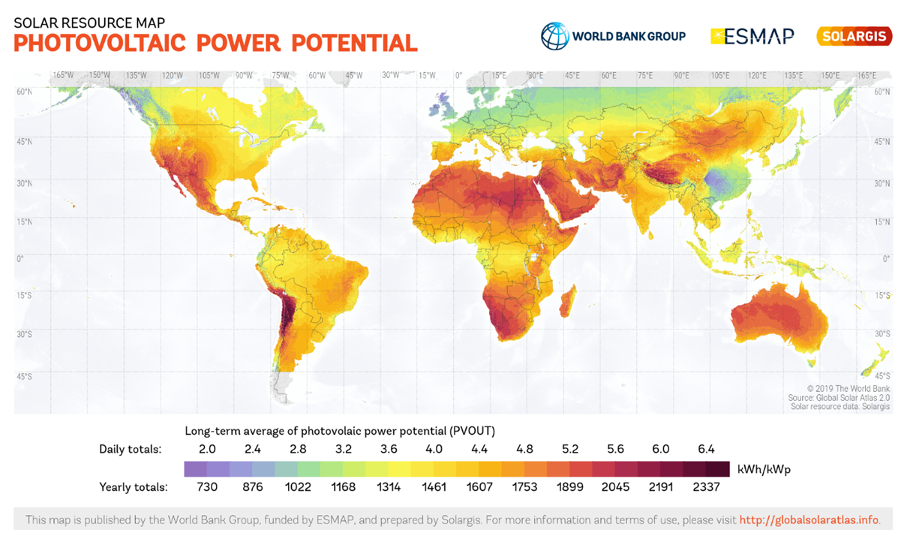
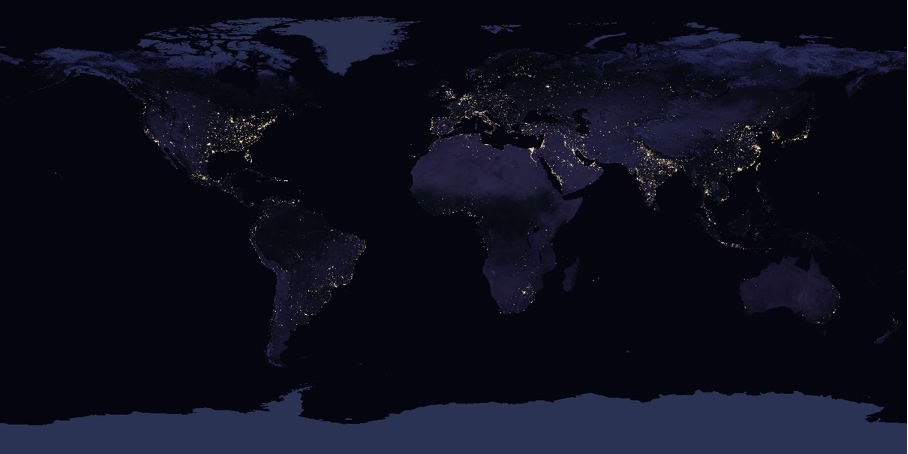
We can draw two main conclusions from these maps:
Returning to the example of the US, the majority of wind and solar power is generated in the Central Plains and the Southwest, respectively, while there is little generation in the east where most economic activity is located. Moving far beyond the tiny 4% of total US primary energy (data) currently supplied by VRE will require generators to be built in poorer quality sites or transported over long distances from high-quality sites.
This is a tricky trade-off because, unlike fossil fuels, wind and solar energy is expensive to move over long distances. Within countries (or between friendly neighbours), high voltage transmission offers a good solution, but it comes with a sizable price tag. Also, as will be discussed in the next section, public resistance is a serious challenge.
International trade of wind and solar energy will require transformation into fuels via hydrogen, which itself is difficult to transport over long distances. An IEA analysis shows the best option is another conversion step to ammonia, which should have similar trading properties to natural gas (easier to liquify but lower energy density), resulting in trading premiums akin to LNG. These conversion steps and transportation costs will inflate the cost of the original energy manyfold.
While challenges with the temporal and spatial variability of wind and solar are relatively well understood, we are only starting to gain experience with a host of other issues. The first of these is rising public resistance to the expansion of wind, solar, and their supporting infrastructure.
VRE-based energy systems are orders of magnitude more visible than conventional systems. Wind is particularly susceptible to this challenge, since the massive turbines can be seen for miles, especially on the vast flat plains and ridgetops where the best resources can be found. In addition, the large transmission lines needed to curb value declines regularly run into right-of-way challenges.
As societies become more advanced, we increasingly demand an invisible energy system. Energy should just happen magically whenever we flip a switch. No unsightly turbines, panels, or wires, no dirty air, no impact on nature. VRE is great for clean air, but its large land footprint makes it very hard to keep out of sight and out of natural ecosystems.
This challenge magnifies in densely populated regions. VRE-friendly Germany offers a good example, where public resistance to wind turbines and transmission lines has almost halted onshore wind expansion around 4–7% of total energy (depending on whether the basis is final or primary energy, see Notes).
Even though Germany is home to only about 1% of the world population, it offers a good indication of future developments on a global scale. For example, the circle in the image below contains more than 50% of the world’s population, and most of these people live in regions with double the population density of Germany. Currently, the per capita GDP of this region is about 4x less than Germany, implying massive growth in energy demand to uplift 4 billion world citizens.
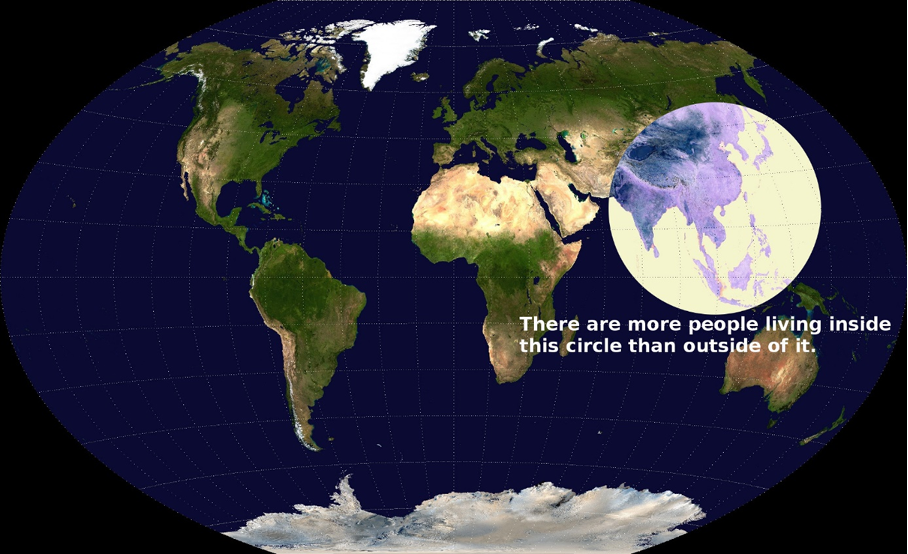
Indeed, the region circled above will shape the future of energy and climate more than any other. And, if the home of the Energiewende is anything to go by, the wind and solar energy expansion will encounter strong resistance, even at shares as low as 10-20% of total energy. In a global energy system dominated by wind and solar, this points to a huge import dependence (with all the associated cost and energy security issues).
The old energy system is beautifully simple. Coal, oil, and gas offer conveniently stored and easily transportable energy neatly packaged into energy-dense solid, liquid, and gaseous forms. If you need energy for any purpose, you choose which form will be the cheapest and most practical and use it where and when the market demands it.
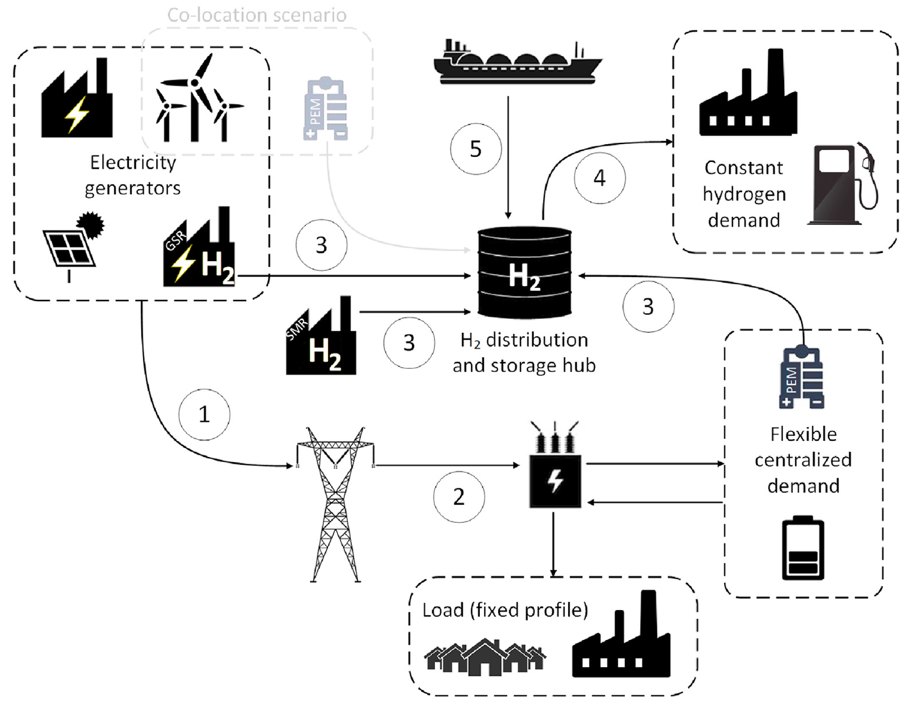
In contrast, energy systems based on wind and solar will be vastly more complex. As primary energy is generated intermittently in a form that is very costly to store and transport over long distances, a vast array of tightly interconnected storage, transmission, transformation, backup, and demand management infrastructure will be required to make this energy useful to modern society.
These technical complexities are augmented by political challenges from the public resistance described In Challenge 3, the rapid scaling of complex new material supply chains (Challenge 6), and several other problems with a rapid transition (Challenges 7–10). Furthermore, this complex system will need to be uniquely tailored for each country based on factors like local VRE resources and geography, population density, and trading partners.
I see system complexity as a stealth hurdle to VRE deployment because of the contradiction to how beautifully simple and streamlined wind turbines and solar panels are to manufacture and install. Currently, VRE accounts for a mere 2–4% of global energy (depending on whether the basis is final or primary energy, see Notes), so system complexity is not yet a significant barrier. Going forward, however, the complexity of the system will increasingly overwhelm the simplicity of individual installations, flipping a major driver of VRE deployment on its head.
Make no mistake — systems with high shares of VRE are possible. I’ve modelled several of them myself, and it’s fun to see the myriad ways in which different technologies can be interconnected to match supply and demand in a least-cost manner. But executing such a system in the real world is a totally different ballgame. Given the high level of complexity and interdependence, such systems may need to be centrally planned and implemented in an authoritarian manner, especially if a rapid transformation is required. Obviously, such a centrally planned overhaul of the very foundation of our civilization brings an intimidating collection of challenges and risks.
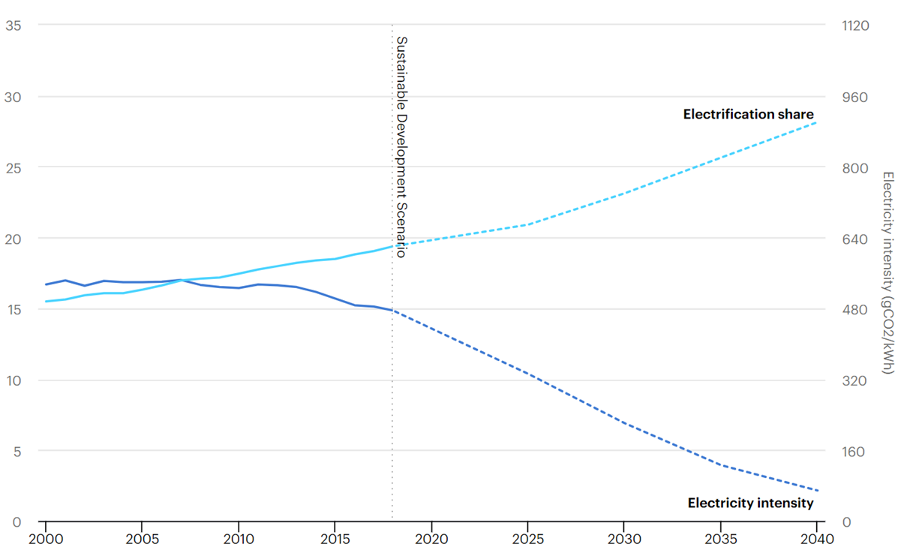
Wind and solar supply electricity, and electricity currently accounts for only 20% of final energy consumption (figure below). As discussed in Challenge 1, value declines keep hampering VRE competitiveness even in the most suitable electricity markets. But things get considerably worse when we start looking at the remaining 80% of energy consumption.
In electricity markets, wind and solar primarily compete with fossil fuels that require expensive power plants to transform chemical potential energy into electricity at a large efficiency loss. In fuel markets, however, the tables are turned. Fossil fuels can be used directly (or after much cheaper chemical transformation), whereas electricity needs to be transformed using expensive electrolysers at a large efficiency loss. In addition, electrolysis from VRE will generate large intermittent fluxes of hydrogen that will be costly and complex to handle.
Yes, there are several cases where electricity can be used directly in new applications, circumventing this challenge. Electric vehicles are by far the most publicly visible example. While they have an important role to play in market segments where they make sense (e.g., two-car suburban families and the luxury segment), reaching a dominant market share (like Norway) brings exorbitant costs.
But passenger vehicles account for only about 10% of CO2 emissions (see Notes), with large reductions offered by hybrids achieving emission intensities half that of the current global car fleet (example). The real challenges are long-distance transport and industry, which emit about half of global CO2 with limited potential for further efficiency gains. Here, fuels will need to do the heavy lifting, making VRE much less competitive than in the electricity sector.
As shown below, green energy technologies are generally much more material-intensive than conventional options. When adjusting for capacity factor, wind and solar require about an order of magnitude more critical minerals than coal and gas power plants, with similar ratios for high-volume materials like steel, cement, glass, plastics, and aluminium.
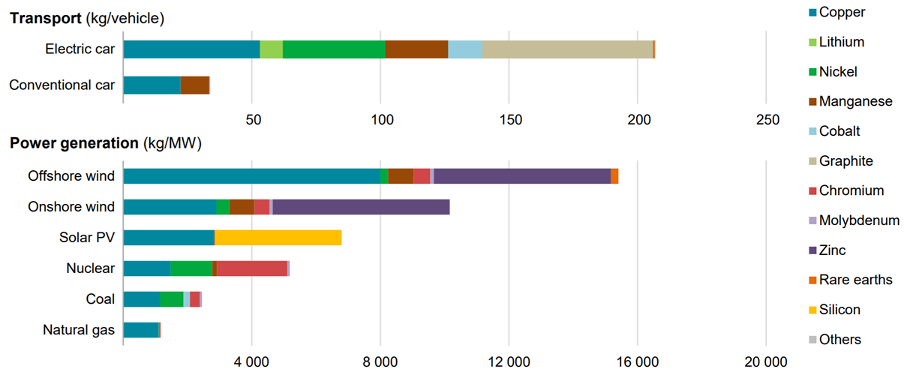
Furthermore, all the additional transmission, storage, and conversion infrastructure required to integrate higher shares of wind and solar bring large additional material requirements. The material needs of transmission networks and battery storage are especially high, requiring massive scaling of various critical minerals.
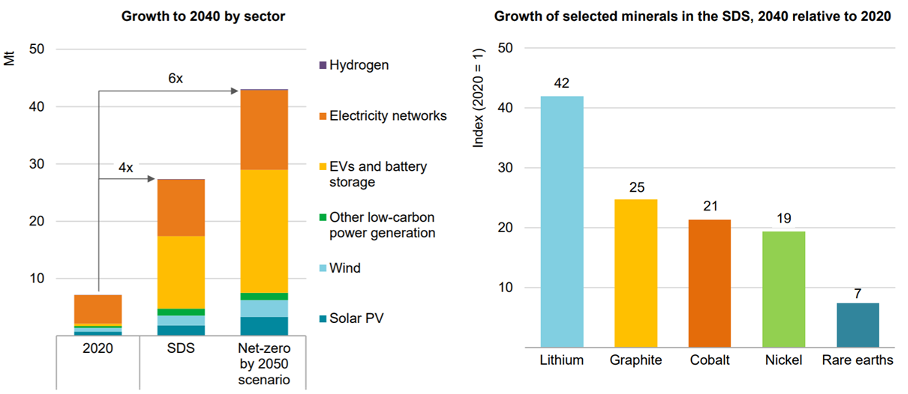
There are many risks associated with such an incredible expansion. The IEA highlights five:
This high material intensity also brings serious end-of-life concerns, which are already in the spotlight for wind and solar. Recycling has a vital role to play in this respect and a lot of work is going into this space. However, the challenge is considerable, especially for solar and batteries, given that multiple materials are layered closely together. Recycling such a complex blend of materials is much more challenging than recycling uniform materials like steel scrap.
As the great commodity price shock of 2021 illustrates, rapid changes can disrupt global supply chains to the point where prices go haywire. Such anomalous prices create all sorts of economic inefficiencies and hit the poor especially hard. (On the bright side, things are good over here in Norway where we’re currently raking in fossil fuel profits to the tune of 3% of annual GDP every month, see Notes.)
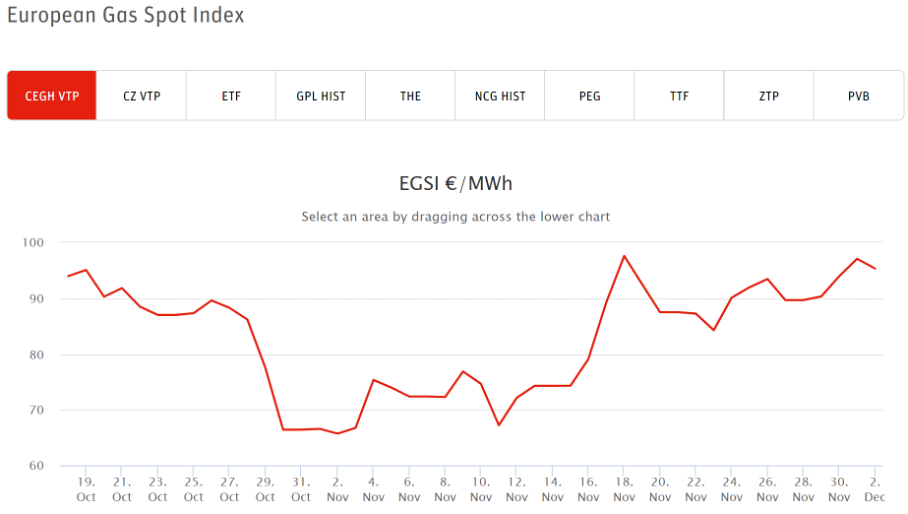
There are many factors that played a role in the price shock, but one of them is the lack of investment in the construction and maintenance of fossil fuel supply infrastructure as funds flocked into green alternatives. While such an investment shift is certainly necessary, the speed is problematic.
The energy transition remains just as dependent on a healthy fossil fuel industry as the rest of the global economy. Oil, coal, and gas still supply 84% of our energy after all (data). Unfortunately, many influential green activists want to wipe out the fossil fuel industry at almost any cost. With this prevailing narrative, the highly inefficient ongoing energy and commodity price shock will certainly not be the last. Ever-greater shares of variable and non-dispatchable generators are not going to help much either (wind and solar generation varies significantly even on annual timescales).
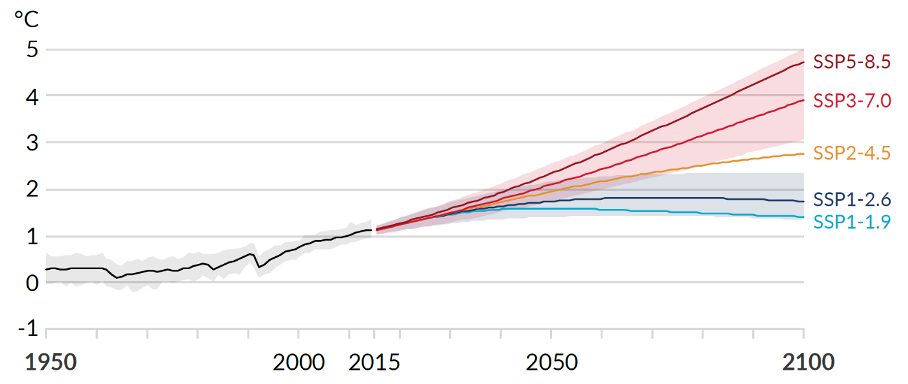
After about half a century of dragging our feet on climate change, the world has suddenly become obsessed with “net-zero by 2050” and the associated extreme decarbonization trajectories. This is textbook human nature, akin to a student procrastinating for weeks before the exam before clocking a series of excruciating all-nighters (which typically results in several failed subjects and almost no long-term retention of the subject matter).

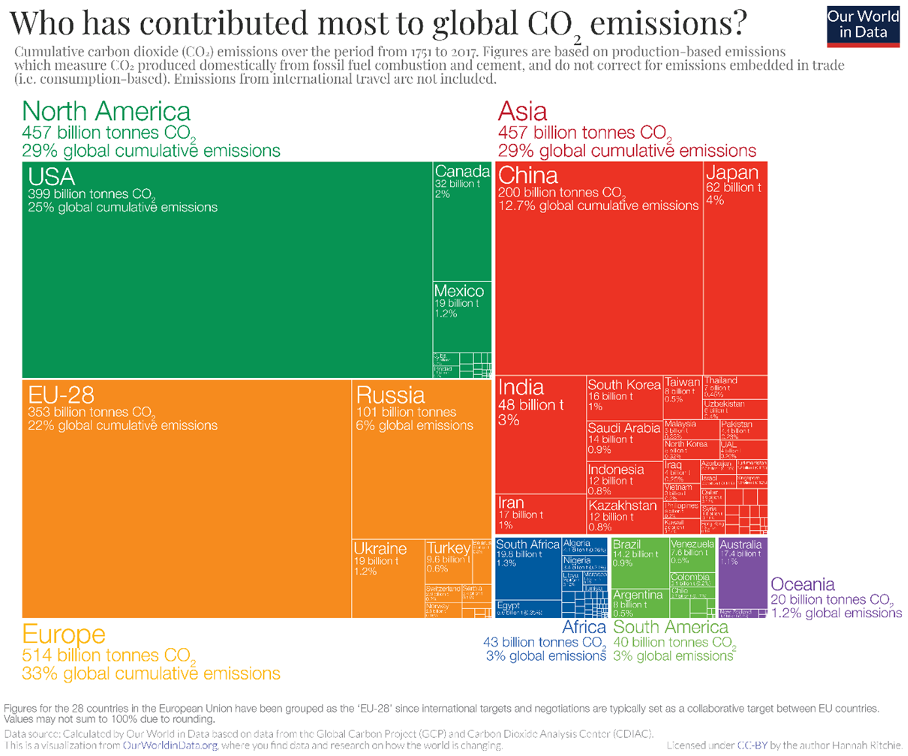
And our metaphorical climate change all-nighter has not exactly gotten off to the most productive start (illustrated below). Obviously, the longer CO2 emissions remain stubbornly high, the more outlandish the “net-zero by 2050” pathway becomes.
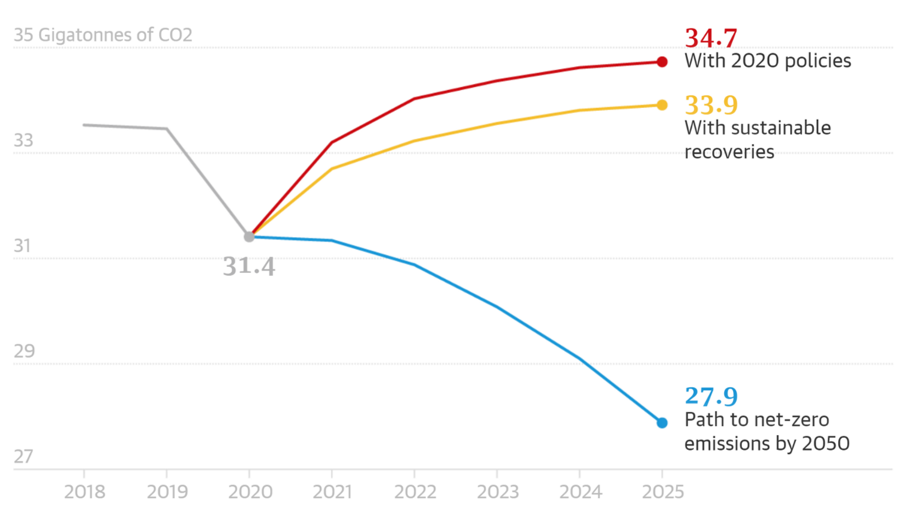
Regardless of the realism or necessity of such drastic decarbonization pathways, they point to a future where we not only stop building any new fossil fuel infrastructure but actually retire plenty of perfectly functional plants well before the end of their lifetimes. This introduces an important additional source of cost and complexity to the transition.
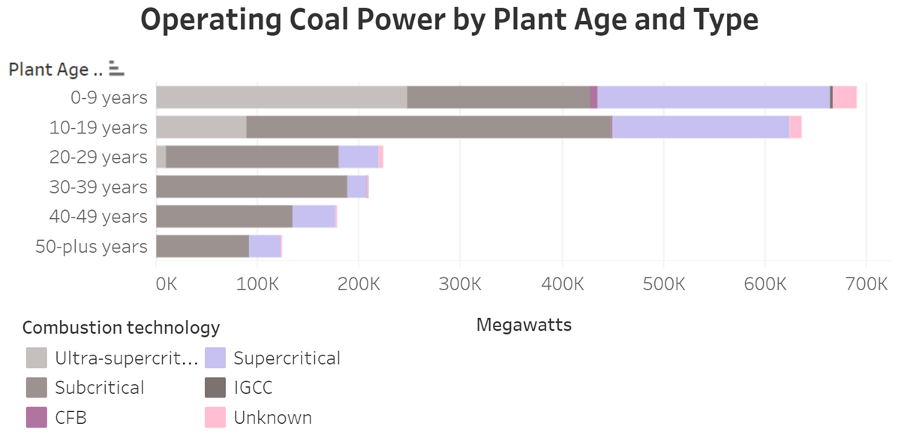
Coal power plants in the developing world are the best example. If all coal plants keep generating until the end of their 50-year lifetimes, they will consume the entire remaining 1.5 degrees carbon budget all by themselves (see Notes). Shutting them down early will require compensation, not only for the plant owners and employees but also for those upstream in the value chain.
More importantly, workers in the old economy will need to be reskilled and affected regions will need plenty of financial support during the transition. For example, Germany will pay about €45 billion for the coal phase-out, €40 billion of which goes for lowering the social costs in coal-mining regions. Imagine that this must be replicated in China, where coal operations are 60x larger.
A VRE-dominated global energy system will require so much more than just installing a lot of wind turbines and solar panels. A vast array of supporting infrastructure must be built to handle the variable and non-dispatchable nature of these generators, the geopolitical energy landscape will be rewritten based on the location of good VRE resources and critical minerals, an authoritarian model may be needed to coordinate the highly complex expansion and deal with public resistance, most of the 80% of non-electrical energy demand will have to be completely revamped based on broad electrification and green fuel production, and vast new upstream (mineral extraction & processing) and downstream (decommissioning & recycling) industries will need to be established.
Furthermore, the speed with which all this must be accomplished will require a carefully managed active destruction of the old energy economy and a massive rise and fall of the new upstream material supply sector to enable a huge peak extraction rate before recycling takes over. And perhaps most important of all (see the final challenge below), all this needs to be accomplished without shrinking the vast productive surplus needed to lift 80% of the world population to decent living standards.
This undertaking represents a mammoth commitment that VRE is our best long-term bet because the alternatives, next-gen nuclear and CCS (including fossil, bio, and other CDR methods), require nowhere near this level of transformation. Thus, getting halfway and realizing that another philosophy is the better choice will result in a level of stranded assets dwarfing that facing the fossil fuel industry in VRE-dominated “net-zero by 2050” pathways.
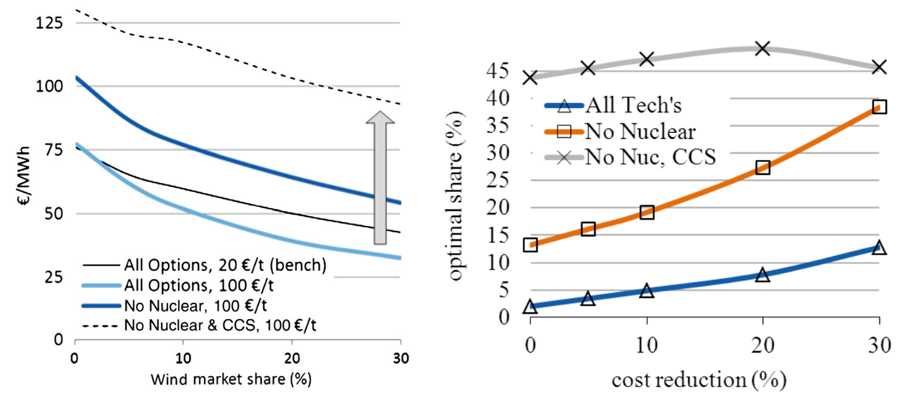
As a simple illustration, the figure above shows how the value and cost-optimal market share of wind plummets when moving from a scenario that bans nuclear and CCS to one that welcomes these (preferably baseload) generators. For example, if next-gen nuclear becomes broadly available and publicly accepted at a time when wind and solar market shares are already high, the introduction of new nuclear plants will greatly devalue all existing wind and solar installations together with their vast array of supporting infrastructure, commencing another complex and expensive multi-decade transition period.
A rapid VRE-led decarbonization effort requires immense capacity investments in new generation, supporting infrastructure, new upstream and downstream industries, and an all-new demand-side sector, while destroying plenty of existing capital. And here’s the real problem: These massive capital outlays will be in direct competition with a much more important global investment initiative.
What is this competing initiative? Eradicating the world’s worst injustice: the lottery of birth.
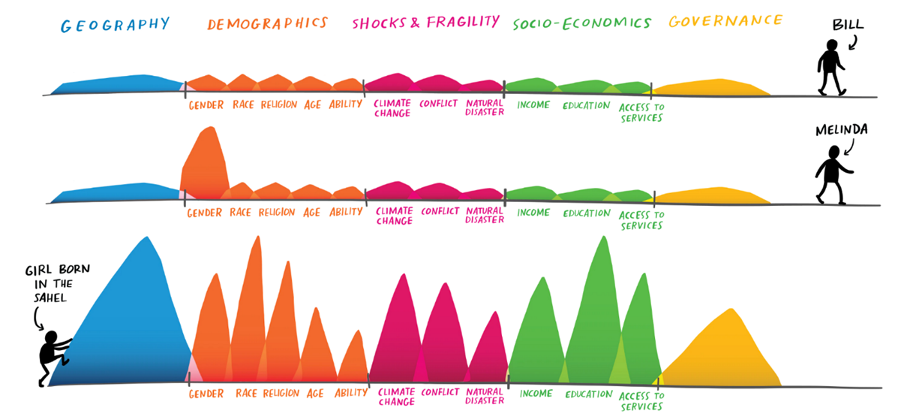
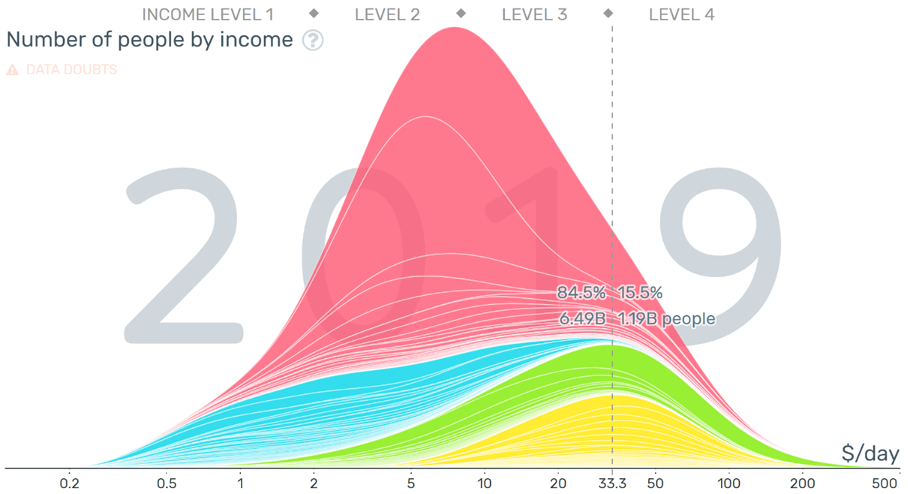
What would you consider to be the minimum income for a decent life? How about $1000/month? Well, given that the average American household (2.5 people) spends $5000/month, most rich-world citizens will be decidedly unsatisfied with $1000/month. Sadly, over 80% of the world population remains below this modest benchmark.
Getting people to $1000/month and beyond requires incredible amounts of new life-enhancing capital in the form of decent housing, industrial sectors, and commercial districts, public services like schools and hospitals, vast transportation networks including roads, rails, ports, airports, and all the machines that use them, massive industrialized farms, and much more. All this requires incredible amounts of materials, energy, and human resources.
As an example, the Chinese economic miracle needed three decades to raise the median per-capita income from $1.2/day to $13/day, emitting about 200 Gton of CO2 in the process. In other words, China needed more than half the world’s remaining 1.5 °C carbon budget to bring half its population (about 9% of world citizens) one-third towards decent living standards. Coal power stands for about a third of these emissions, but 42 billion tons of cement and 18 billion tons of steel (the building blocks of society) emitted just as much (see Notes).
From a climate perspective, the billions of world citizens who lost out at the lottery of birth have much more to gain from rapid economic expansion than rapid CO2 emission cuts, both in terms of longer and better lives and reduced climate vulnerability (including proactive adaptation programs). They also have a solid moral argument, given that their per capita historical emissions remain far below that of the West (e.g., 170 tons/capita for China vs. 1270 tons/capita for the US), even before correcting for all the CO2 emissions flowing into the rich world via cheap imports.
Expanding the vast VRE ecosystem described in the previous challenges will create competition between infrastructure for economic upliftment and infrastructure for clean energy supply, delivery, and use. For example, displacing a $1 billion coal plant in China with solar and batteries in the longer term will require about $4 billion in capital (assuming 400 $/kW solar and 4x100 $/kWh batteries with a 4x lower capacity factor than 800 $/kW coal). And the coal plant will probably still be needed to secure supply during cloudy winter spells. Of course, the numbers look considerably worse for industries like steel and cement.
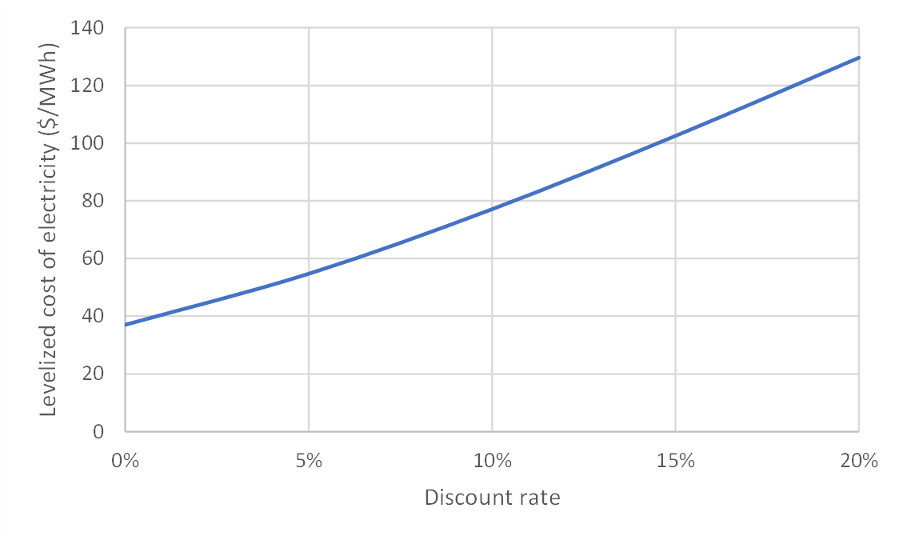
An important factor that sustains the VRE expansion despite its capital-intensive cost structure is progressively lower financing costs. But this is a socio-economically inefficient phenomenon created by central bank stimulus and market designs that guarantee investor returns regardless of large future value declines. In a healthy market where VRE generators are fairly exposed to the slew of risks outlined above, discount rates during a rapid transition would be in the 12–16% range, depending on the local growth rate. This would double levelized costs, correctly prioritizing less complex and capital-intensive decarbonization pathways.
Despite impressive cost reductions in green technologies, a rapid VRE-led global decarbonization effort will be very expensive, complex, and risky. Value declines and integration costs from the temporal and spatial variability of VRE are enough to cancel out cost declines, even in markets with the highest wind and solar resource quality. And that is before we even get to the other eight challenges described in this article.
That being said, renewable energy remains a crucial part of the clean energy landscape, and a high share of VRE deployment in regions with excellent resources makes good sense. There are many such regions where VRE can avoid CO2 at an attractively low cost, and these opportunities should certainly be exploited. But this is a far cry from the VRE-dominated global energy system by mid-century demanded by many green activists.
Addressing climate change is an important global priority, but it is not the “1.5 °C at any cost” type of problem regularly portrayed in the media. We still have time to execute a holistic sustainable development strategy that correctly balances decarbonization and economic upliftment, while fully exploiting the potential of life efficiency, climate change adaptation, and a wide range of other low-carbon supply options.
If we do it well, the global economy will be so productive, connected, and well-insulated by 2050 that we can safely handle anything climate change throws our way. If we do it poorly, our energy system, the very foundation of society, may become unable to continue uplifting billions of people to decent living standards. This would be a tragedy, not least because of the 1.5 degrees of global warming already locked in regardless of what we do.
Thus, I would like to end this long article with my usual recommendation: Put a price on CO2 that correctly balances decarbonization and economic upliftment, scrap all technology-forcing policies, and watch the market leverage the power of the entire economy (not just the energy supply sector) for conquering the great 21st-century sustainability challenge.
illuminem Voices is a democratic space presenting the thoughts and opinions of leading Energy & Sustainability writers, their opinions do not necessarily represent those of illuminem.
Primary energy is raw unprocessed energy (like oil) before transformation into forms that are useful to society (like gasoline). Final energy is energy in the forms we consume (e.g., electricity or gasoline).
In primary energy calculations, VRE is often multiplied by about 2.5 to account for the fact that it currently displaces mainly coal and gas power plants with an efficiency of only about 40%, thus making the VRE share look larger. However, this may be overoptimistic for three reasons:
When considering final energy, the VRE share is lower because it does not benefit from the 2.5x conversion factor. However, this may be an underrepresentation of the VRE contribution because electricity is generally a more useful form of final energy than others (like gasoline). Thus, the true contribution of VRE will lie somewhere between the share of primary and final energy.
On a global level in 2020, total primary energy was 556.6 EJ, whereas wind & solar summed to 21.7 EJ (data) — a 3.9% share. Electricity consumption was 26823 TWh, with wind and solar summing to 2447 TWh for a 9.1% share (data). Electricity is only 20% of final energy, so the wind and solar share of final energy is 1.8%. These shares are a little optimistic because of the temporary impact of the pandemic on 2020 energy demand.
The passenger transport sector (cars, buses, and two-wheelers) consumes about 27 million barrels of oil per day, and each barrel emits about 0.43 tons of CO2 for about 4.2 Gton of CO2 per year. Global CO2 emissions from human activities (mainly fossil fuel combustion, cement production, and land use change) amounted to 43 Gton in 2019 (with a temporary reduction to 40 Gton in 2020). Thus, passenger transport has a 10% share of CO2 emissions.
The historical surge in European natural gas prices is a large boon for Norway. The country exports about 1200 TWh of natural gas per year. At a historically high profit margin of 80 €/MWh, this amounts to €96 billion per year (about 27% of GDP). At current oil prices, Norwegian oil rents add about 6% of GDP for a total of 33% (or a little under 3% of annual GDP per month).
Assuming a 50 year lifetime, the ~2000 GW of coal plants younger than 50 have an average remaining lifetime of about 32 years. At a capacity factor of 65% and a CO2 intensity of 0.9 ton/MWh (representative of a 40% efficient coal plant), this amounts to about 328 Gton of CO2 in total — equal to the remaining 1.5 degrees carbon budget.
Between 1990 and 2020, China grew its median income from 1.2 to 13 $/day (data). Increasing the income of well over a billion people by an order of magnitude in one generation is a truly momentous achievement, but it required 186 Gton of fossil fuel and 15 Gton of cement emissions. Over this period, China produced 72500 TWh of coal power, amounting to 65 Gton of CO2 at a CO2 intensity of 0.9 ton/MWh.
Data from these graphs (with recent estimates) indicate 42 billion tons of cement and 18 billion tons of steel over this 3-decade period. Cement emits about 60% of its emissions directly from the limestone and another 40% from the fuel, whereas each ton of steel emits 2.15 ton of CO2. Thus, cement emitted about 25 Gton and steel about 39 Gton for a total of 64 Gton — about the same as coal-fired power plants.
Arvea Marieni

Climate Change · Carbon Market
Jeremy Bentham

Energy · Climate Change
Filip Koprčina

Energy Transition · Sustainable Investment
Forbes

Renewables · Nature
Financial Times

Oil & Gas · Energy
The Guardian

Net Zero · Oil & Gas