China’s success with wind and solar vs nuclear is explained by Bent Flyvbjerg’s new book


· 8 min read

Roughly a year ago I updated my data set on the natural experiment of wind, solar and nuclear generation capacity additions in China for illuminem. On February 7th, 2023, a version of that material will be published as an inclusion in Professor Bent Flyvbjerg’s new book, How Big Things Get Done. With that publication and the passing of another year, it’s worth seeing if 2022 changed the results in any meaningful way.
But first, Flyvbjerg’s book, co-authored with Dan Gardner. The full title is How Big Things Get Done: The Surprising Factors That Determine the Fate of Every Project, from Home Renovations to Space Exploration and Everything In Between, and it’s topping Amazon pre-order charts in its category. That’s well deserved, and I would say that regardless of whether my material was included in it.
As part of my somewhat eclectic background, I was a project management thought leader, working with Max Wideman, primary leader on the PM-BOK, on iterative and incremental methods for major program delivery, and an international estimation SME, transformation project leader and troubled project fixit guy for with a global technology firm, working on programs up to a billion USD in value. As an occupational hazard of that line of work, I’ve read more about project management successes and failures than most, and experienced virtually every failure condition Flybjerg documents in his extensive body of work. And yes, some of those experiences of failure were self-inflicted.
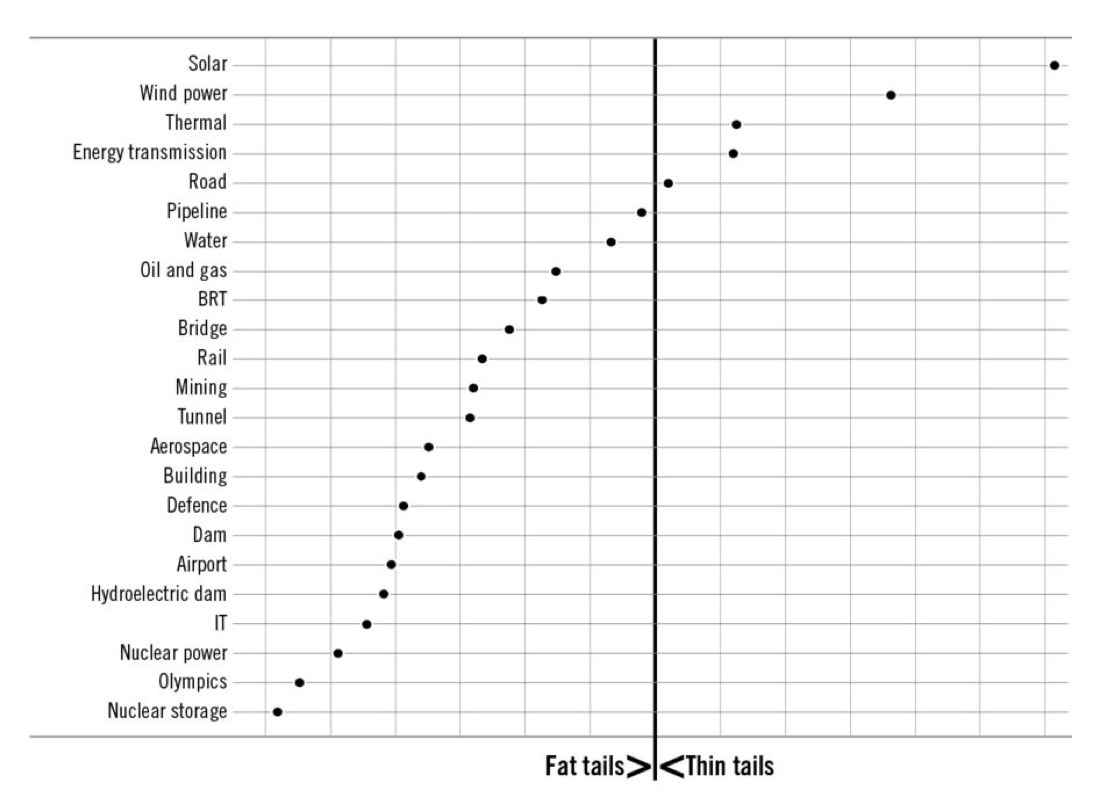
Why is my data in there? This diagram from the book tells a story.

Flyvbjerg and team have been assembling a cleansed data set of roughly 16,000 projects where initial cost, budget and benefit estimates were known, and final cost, schedule and benefits outcomes are available. It’s taken over 20 years, but the information is startling and useful.
A key aspect Flyvbjerg leans into is fat-tailed risks, which are potential failures with high-impacts that occur toward the edges of bell-curve distributions. His thesis, very well supported by data, is that many project types are subject to much greater occurrence of fat-tailed risks than other project types, and hence are much more likely to go over schedule and budget, often by very large amounts, and much less likely to deliver benefits.
In fact, he and his team refer to this as the iron law of projects, in that only 0.5% of the 16,000 projects were completed on time, on budget and delivered the promised benefits.
And so, to wind, solar and nuclear. Looking back at the chart, we can see that solar and wind projects are #1 and #2 in projects most likely to meet cost targets. And that nuclear power construction projects — and Flybjerg’s data includes decades of them from countries outside of China — are third from worst projects by that metric, only being outstripped by Olympics and nuclear storage facility construction efforts.
That point about China is why Flyvbjerg and Gardner reached out to me to ask to include my assessment on China’s deployment. As he and I discussed recently, getting data on specific Chinese projects is close to impossible. While summaries are available, China doesn’t publish or share details like that. It’s clear to me that they know the numbers very well, and use them to assess their five-year targets and adjust to what works best, but they adhere more to Sun Tzu’s teachings about holding things close to your chest, rather than to the USA’s more Kardashian-style approach.
So why is China a good natural experiment for the three generation technologies? Well, there are a lot of claims in the west that nuclear generation would clearly scale much faster than wind or solar and be much cheaper than it is, if it weren’t for western over-regulation and the fears of the population. But China clearly has advantages as a more top-down managed economy, with the national government able to override provincial and local concerns, align regulatory requirements across the massive country — 1.4 billion citizens in a contiguous land area the size of all of the United States —, and attend much less to the opinions of local citizens. And China established national strategic programs for each of wind, solar and nuclear as well. For each of the three technologies, China is deploying Chinese-designed and manufactured versions of them.
The conditions are about as controlled as it is possible to get. Multiple variables have been eliminated. And the data is publicly available. It’s an excellent natural experiment, although not as titillating as the one where half of an island lost electricity for six months, and researchers used that to predict and test variances in birth rates among people with mod cons like tvs and the internet vs people who had to rely on more traditional means of entertaining themselves.
When I published initially on this experiment in 2014, it was clear to me that wind and solar would outstrip nuclear, for the same reasons that Flyvbjerg strongly recommends modularity in his work, consulting and now the book. Wind and solar are much more like the computers that power most of the internet — smaller, networked and in vast numbers — than the mainframes that preceded them (and which still exist and are doing very useful work today). And that value proposition of what is called horizontal scaling in computer systems makes a huge difference.
A bunch of identical manufactured objects being built in highly repeated, highly parallelized processes will always be faster and lower-risk to construct than single, massive, complex, bespoke engineering efforts. Strings of solar panels can be built with unskilled day labor picked up on street corners. Wind farms are heavily automated construction sites where the foundation is laid in a day, the mast goes up in a day and the nacelle and blades are up on the third day. Both wind and solar farms can start generating electricity as soon as the power management solution is in place and connected to the grid, as well.
But what was clear to me (and many others) was not clear to everyone. A tremendous legacy group of energy analysts were stuck in a paradigm of major generation assets close to energy demand areas, and couldn’t see the advantages of modularity and parallelization. And most of them considered too much transmission to be a bad thing.
That’s another point worth noting in Flyvbjerg’s data. Transmission projects are in the #4 spot in his data set. They have a strong tendency to complete on time and budget as well. As Flyvbjerg and I agreed, we were both relieved and delighted to see that the major technologies required for decarbonization of the grid were so low-risk and empirically successful, relatively speaking. China, by the way, has also installed tens of thousands of kilometers of HVDC transmission to go with its masses of wind and solar.

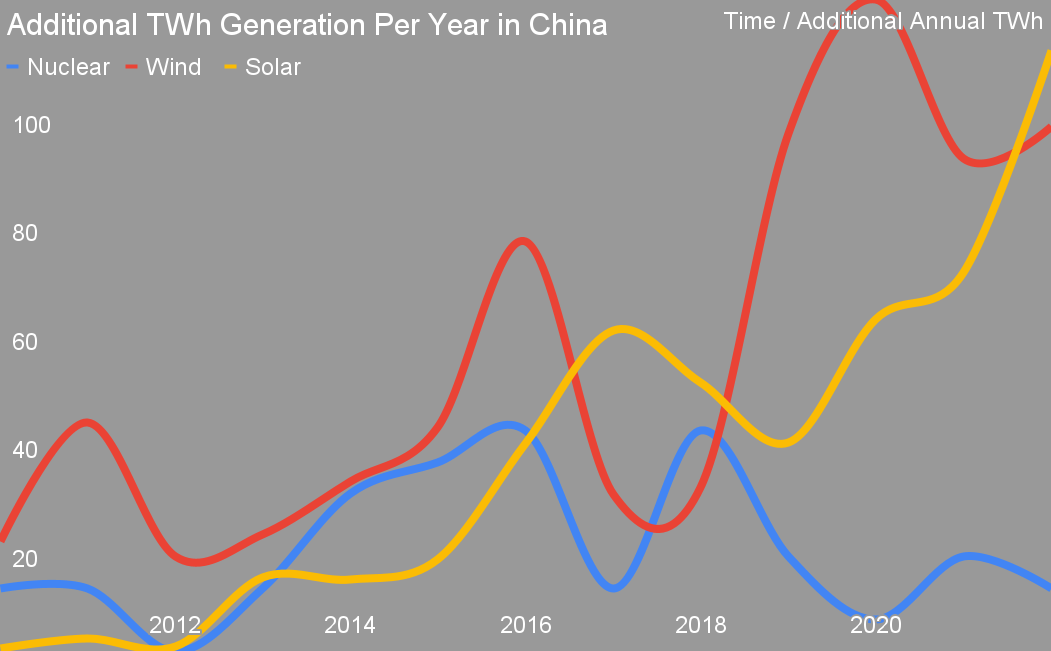
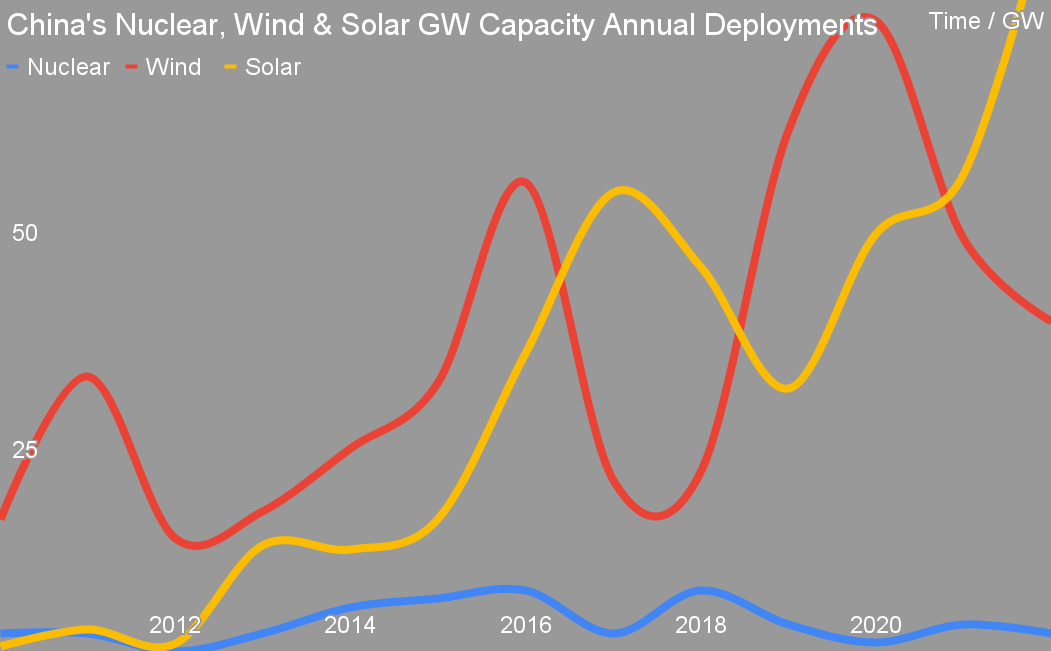
And so to the updated results of the experiment. China’s 2022 deployments are in. Two nuclear reactors, about 2 GWs of capacity, were connected to the grid last year. About 38 GWs of capacity of wind generation was added. And 87 GWs of solar generation was added. What that means using Chinese capacity factors for additional TWh of actual electricity provided in every subsequent year is in the chart that leads this article.
China’s nuclear program peaked seven years ago in 2016, when seven reactors were connected to the grid, something it also managed in 2018. Since then, it’s only been able to add 1-3 reactors a year. This is not a program that’s accelerating. This isn’t a program which is succeeding.
As I noted in earlier discussions of this material, China’s wind and solar programs both radically outperformed their 2020 targets, by 25% and 100% respectively, while the nuclear program failed to achieve its goals. Since 1978’s special economic zones were created, China’s policies toward transformation have been shaped by Deng Xiaoping’s maxim 摸着石头过河 or cross the river by feeling the stones. Small tests in part of the country. If successful, expand. If unsuccessful, adapt and try again or drop.
And so my expectation is that China’s nuclear program’s relative failure means that the nuclear industry’s rosy projection of a China-lead nuclear renaissance globally is deeply unlikely. Instead, I expect China to scale back its nuclear program and lean into wind, solar, transmission and storage like their massive pumped hydro program more fully. They repeat what succeeds.
And my recommendations: buy Flyvbjerg and Gardner’s book. Pre-order it on Amazon or Audible. Buy it for yourself. Actually read it. Buy it for people who need to read it. For investors, energy strategists and energy policy makers, put the project failure rates chart on the walls of your offices and boardrooms. For project delivery executives and managers, put the Coda of rules of thumbs for project success on the walls of your offices, planning rooms and war rooms. How Big Things Get Done is the most useful and accessible book on project success and failure that’s been written to date.
Editor's note: The author states no conflict of interest and receives no financial benefit from the contents of this article.
illuminem Voices is a democratic space presenting the thoughts and opinions of leading Sustainability & Energy writers, their opinions do not necessarily represent those of illuminem.
Alex Hong

Energy Transition · Energy
illuminem briefings

Hydrogen · Energy
illuminem briefings

Energy Transition · Energy Management & Efficiency
Financial Times

Power Grid · Power & Utilities
The Guardian

Natural Gas · Greenwashing
Politico

Solar · Public Governance