
· 8 min read
Summary
To keep global warming below 1.5 °C, our energy systems need to be carbon emission free latest by 2050, and many countries have pledged to do so. A high-level model was built for a fictitious economy called Utopia to assess three pathways towards a zero-carbon economy by 2050: a gradual (linear) replacement of fossil fuels by clean energy, an accelerated pathway leading to a carbon free system by 2035, and a delayed pathway, in which replacement takes place from 2035 onwards. The model yields very clear results. The accelerated pathway is not only 21% cheaper than a gradual phasing out of fossil fuels, with accumulated savings of $4 trillion over a period of 30 years, but also the climate wins, with emissions reducing from 32.7 GT to 13.1 GT over the same period. On the other end of the spectrum, the delayed transition is 20% more expensive than the gradual transition, and a whopping $7.7 trillion more expensive than the accelerated pathway, with 4 times higher emissions of CO2.
It should be noted that the main driver of the cost difference of the three pathways is the price of carbon. Running the model without a price on carbon yields a level playing field regarding overall cost for the three pathways. Of course, in the accelerated pathway, CO2 emissions are much lower than the gradual or delayed pathway, which should be an incentive in its own right.
Introduction
The modern energy sector has always been a major source of greenhouse gas emissions, but in recent years, clean energy solutions have been developed that are quickly changing that. With increasing deployment, economies of scale and ever higher efficiencies, modern renewable electricity is now on average cheaper than conventional fossil power [1] and quickly replacing coal, natural gas, and oil power stations all over the world. Renewable electricity can be used directly or used to produce clean molecules such as hydrogen or ammonia, with the ability to fully replace all fossil fuels, also in non-electric sectors. To achieve the Paris Agreement implies a zero-carbon energy system latest by 2050. This paper compares three global, high-level pathways towards that goal and quantifies the relationship between transition speed and overall cost and CO2 emissions.
Utopia
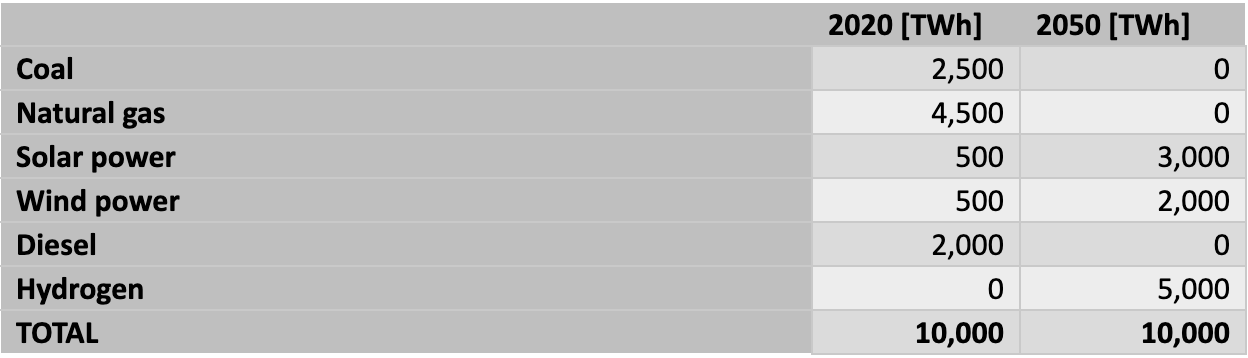
To assess the different pathways, “Utopia” was conceived, a fictitious, developed economy with several hundred million inhabitants in a moderate climate with good renewable energy resources. The people of Utopia drive cars, heat and cool their houses and they have developed several industries based on steel and other mined products. They also grow their own food, for which they produce fertilizers. Their current final energy demand amounts to 10,000 TWh per year and consists of 20% electricity, while 80% comprises natural gas for heating and fertilizer production, coal for power production and steel making, and diesel for transport. Utopia has a well-developed energy infrastructure for electricity and natural gas. In recent years Utopians have adopted an ambitious green electricity strategy and half of Utopia’s electricity is now produced by wind and solar power. Utopia is a signatory to the Paris Agreement and aims to fully decarbonize its economy by 2050. In many ways, Utopia looks like Europe. The current annual final energy consumption of 10,000 TWh is not expected to change because energy efficiency measures keep pace with demand growth. Utopia’s least cost expansion models show that direct electrification should increase 2.5 times to cover 50% of all final energy by 2050, which is roughly in line with global assessments done by the IEA and IRENA. For the remaining 50% of final energy demand, Utopia will use green hydrogen, since their models show that the existing gas pipeline and storage system can be used, which makes hydrogen the cheapest solution. Hydrogen will be used as a transport fuel in addition to electric mobility, to produce high temperature heat, to make steel, fertilizers and chemicals, for cogeneration of electricity and heat and to balance electricity supply and demand. Table 1 shows Utopia’s energy mix in 2020 and the projected mix in 2050.
Model and pathways
For Utopia’s energy system, a high-level cost model was built, using parameters and input described in Table 2. The values for solar, wind and green hydrogen and their development over time were taken from Lazard’s most recent Levelized Cost of Energy Analysis – Version 14.0 and the IEA, whereas other sources were used for the cost of conventional power and fuels. The costs of fossil fuels are assumed to be constant over time until 2050, because frankly, nobody really knows. However, as one of the main policy tools to drive the energy transition, Utopia introduced a carbon pricing mechanism, with CO2 currently at $50/ton until 2025, at $100/ton between 2025 until 2030 and $150/ton thereafter. In addition to generation cost, the cost of electricity grid expansion and additional storage and flexibility has been considered. Utopia has a well-developed infrastructure for fossil fuels, and hydrogen can use the gas grid, natural gas storage infrastructure and fuel distribution system at no or marginal additional cost compared to the current situation.
![Table 2. Modeling input parameters. Sources:
[2] Average coal price taken over the last 10 years, 2012-2021, as per https://tradingeconomics.com/commodity/coal.
[3] Lazard’s Levelized Cost Of Energy Analysis—Version 14.0 – October 2020, average natural gas cost of 3.45 $/mmbtu (https://www.lazard.com/media/451419/lazards-levelized-cost-of-energy-version-140.pdf)
[4] Diesel price 2020 value taken from globalpetrolprices.com, assumed to be constant until 2050, The cost value was derived as 72% of the average global price of $1.16 per liter, with 51% of the price for the cost of crude and 21% for refining, as per EIA’s assessment. The remaining 28% for marketing, distribution and tax are not considered.
[5] Lazard’s Levelized Cost Of Energy Analysis—Version 14.0 – October 2020. The fuel cost of coal and natural gas are assumed to be constant until 2050. (https://www.lazard.com/media/451419/lazards-levelized-cost-of-energy-version-140.pdf)
[6] True Cost of Solar Hydrogen - Eero Vartiainen 2021. The model uses average values for solar PV and hydrogen calculated for Europe. (https://onlinelibrary.wiley.com/doi/epdf/10.1002/solr.202100487)
[7] IEA Task 26, Forecasting Wind Energy Costs and Cost Drivers – June 2016, using Lazard’s 2020 estimate as a starting point (https://eta-publications.lbl.gov/sites/default/files/lbnl-1005717.pdf)
[8] Additional integration cost are costs for additional flexibility such as storage, additional network cost and dispatchable power as assessed in the Sixth Carbon Budget by the UK Climate Change Committee (https://www.theccc.org.uk/publication/sixth-carbon-budget/)](https://illuminem.b-cdn.net/articlebody/a023cde702f987eab61021c3caaf58fa152bc26a.png)
Using above parameters, three global pathways were calculated and compared: a gradual development pathway, with solar, wind and hydrogen growing linearly and gradually replacing fossil fuels, both for power production, transport, and industrial uses, until 2050, an accelerated growth pathway, where solar, wind and hydrogen replace fossil fuels by 2035, and lastly, a delayed growth pathway, in which green energy starts replacing fossil fuels after 2035. Overall annual costs were calculated and aggregated over the period 2020-2050, considering a 2% inflation rate. Figure 1, Figure 2 and Figure 3 show the key metrics of the gradual, accelerated and delayed scenario over time.
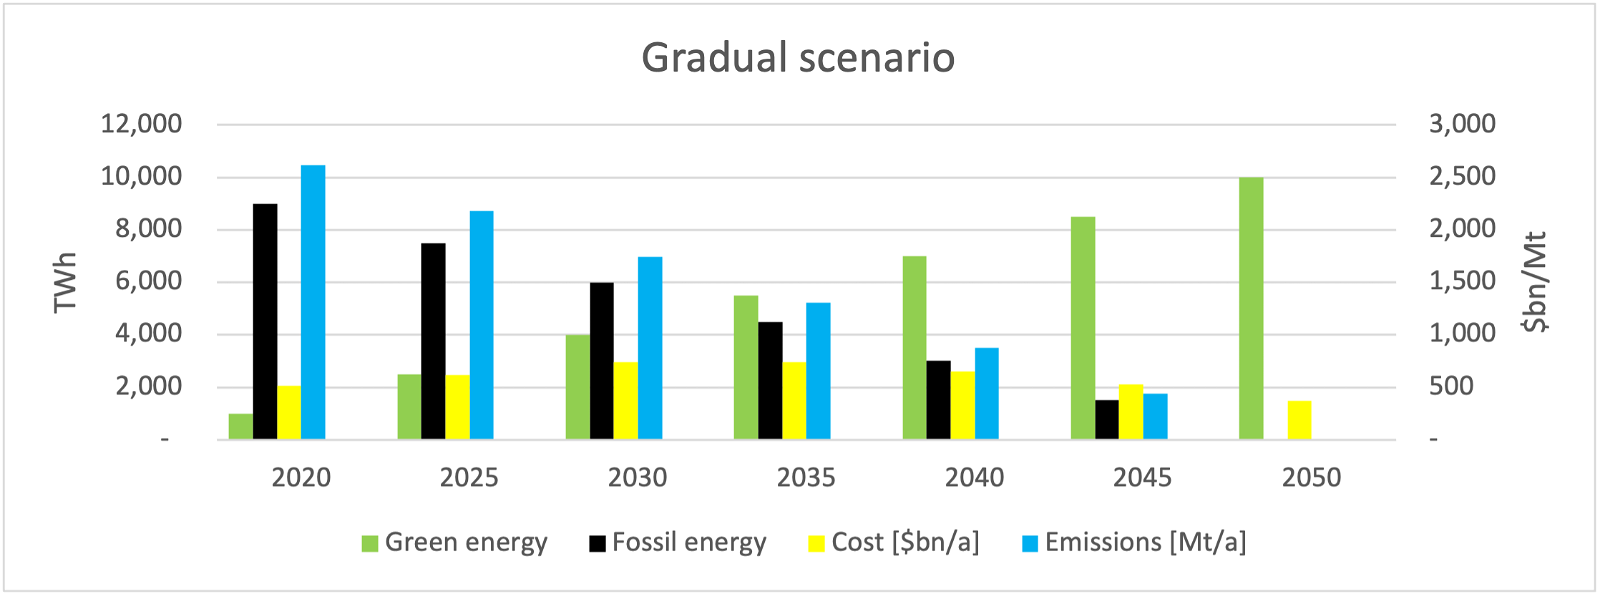
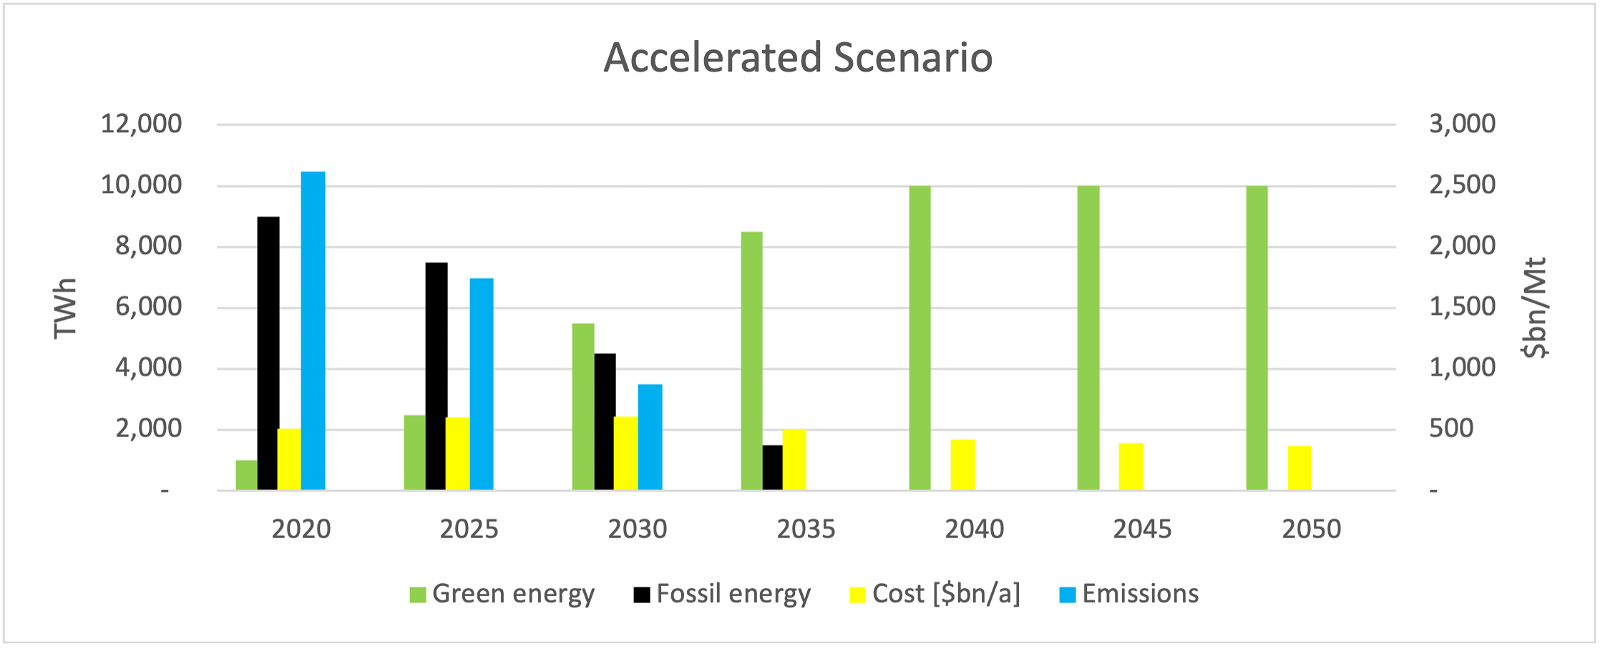
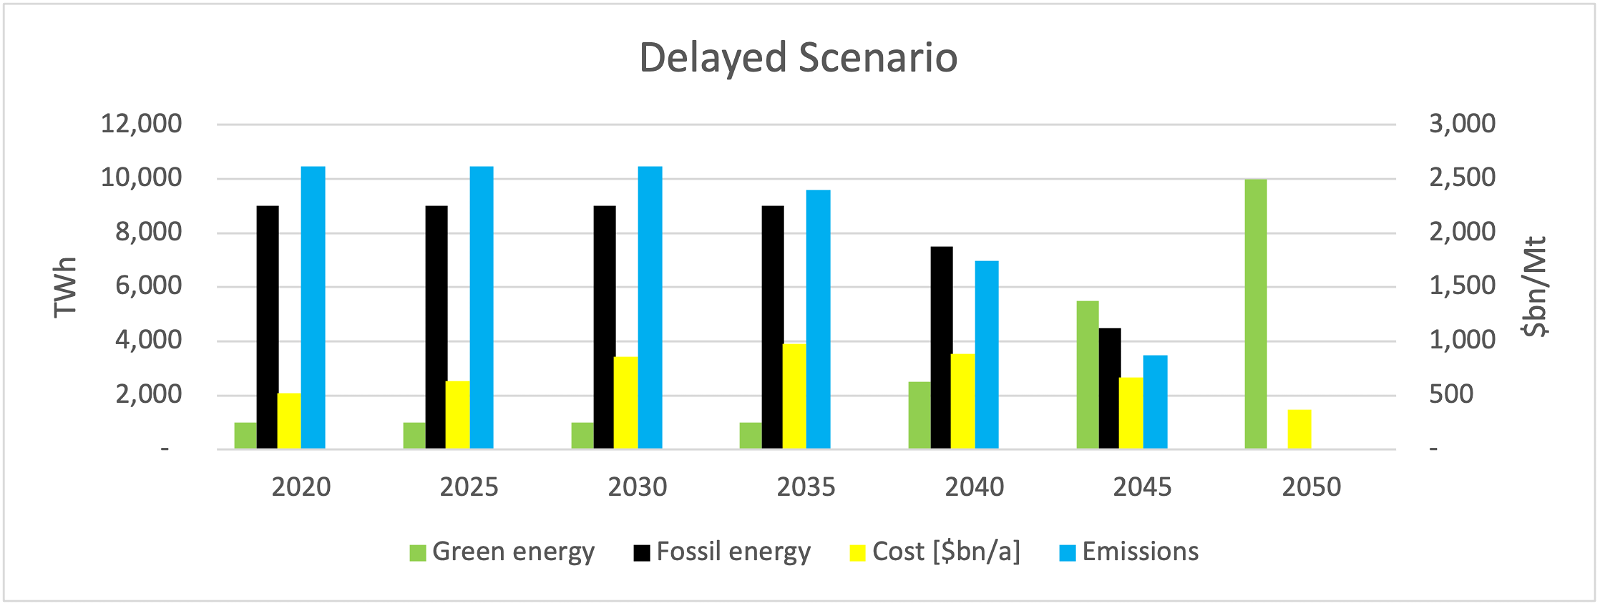
Table 3 contains an overview over the energy mix development for the three modelled pathways, as well as their cumulative costs and emissions for the Utopian society.
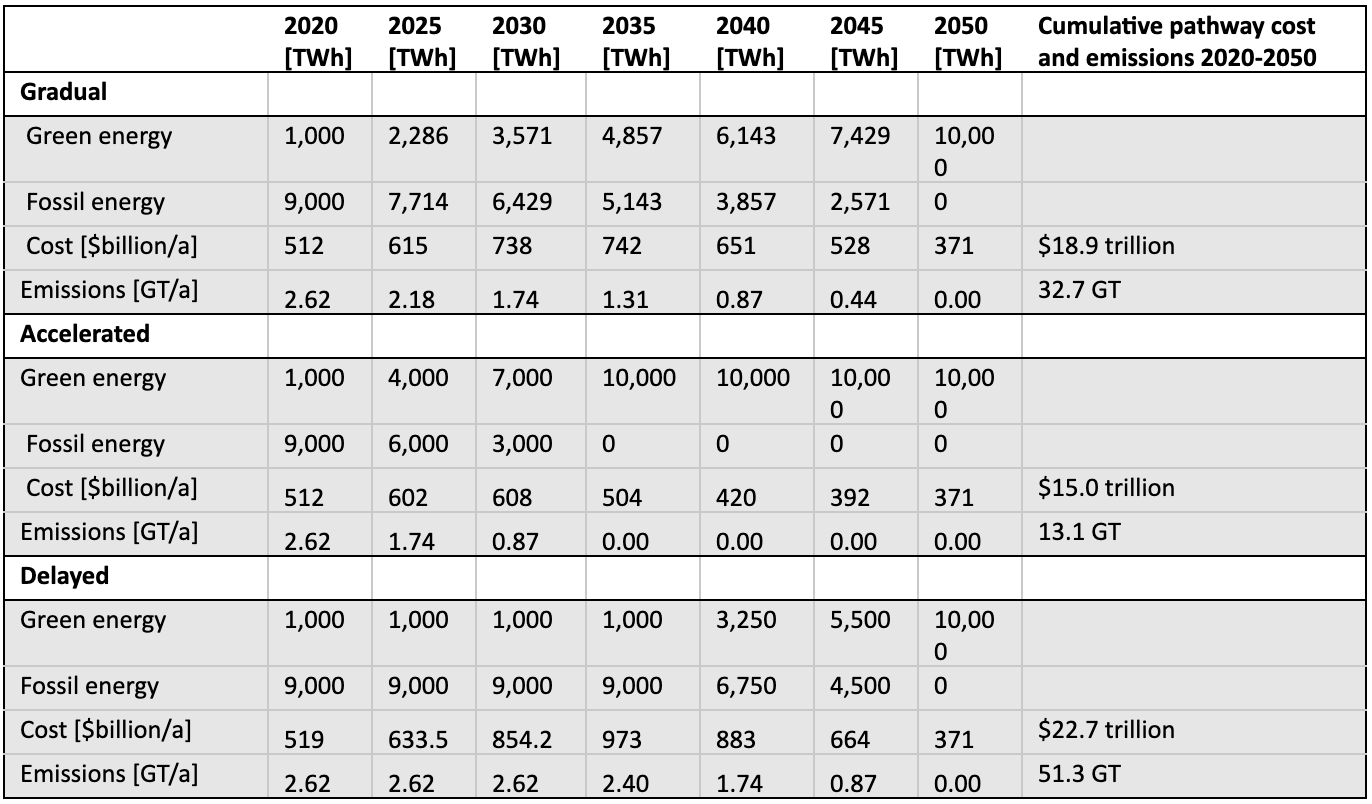
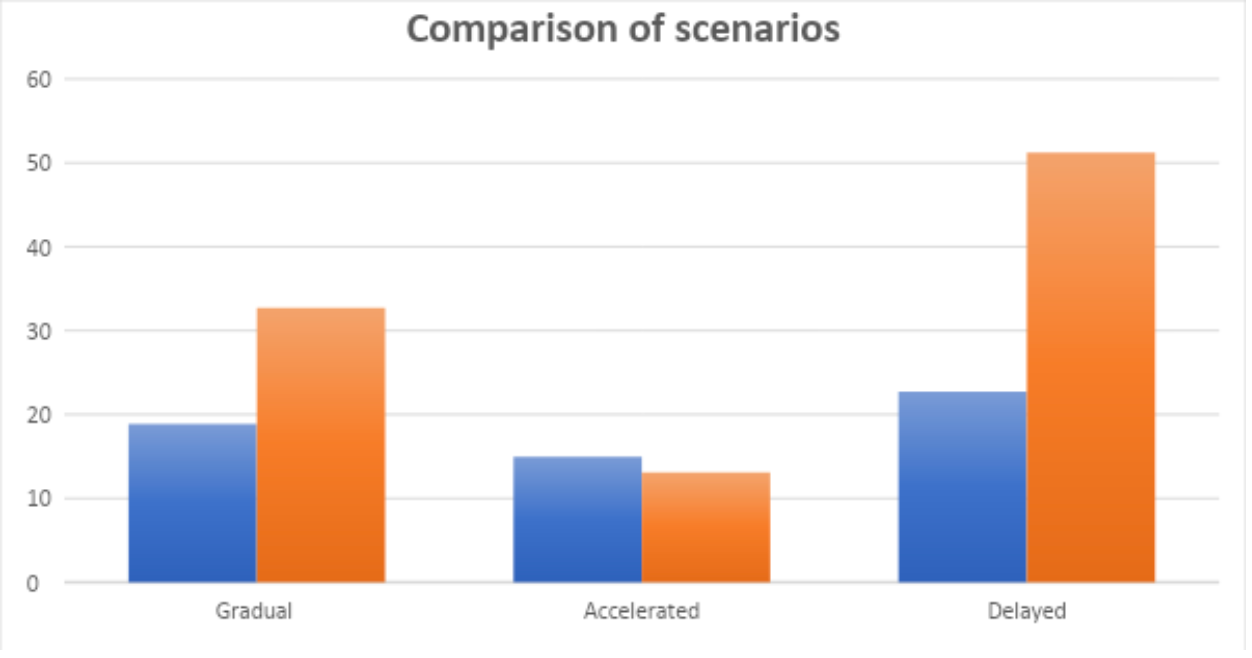
Figure 4 shows a comparison of the cost and cumulative emissions for the three scenarios.
Conclusion
As can be seen from the modeling results in Table 3, there is a clear winner when comparing the three transition pathways for Utopia. The accelerated pathway is not only 21% cheaper than a gradual phasing out of fossil fuels, with accumulated savings of $4 trillion over a period of 30 years, but also the climate wins, with emissions reducing from 32.7 GT to 13.1 GT over the same period. On the other end of the spectrum, the delayed transition is 20% more expensive than the gradual transition, and a whopping $7.7 trillion more expensive than the accelerated pathway, with 4 times higher emissions of CO2.
It should be noted that the main driver of the cost difference of the three pathways is the price of carbon. Running the model without a price on carbon yields a level playing field regarding overall cost for the three pathways. Of course, in the accelerated pathway, CO2 emissions are much lower than the gradual or delayed pathway, which should be an incentive in its own right.
Change is hard, and the accelerated pathway introduces a lot of change in a very short timeframe. Many people and organizations will most certainly try to put the brake on the transition, as we have seen in the last decades. We should also realize that such a tectonic shift in a compressed timeframe will certainly not only produce winners, and many assets will have to retire before their economic life would have ended. Many jobs will be lost, although new ones will be created, and it will not be easy to re-direct all the workforce in the new fields. But the message is clear, a faster transition is better and cleaner. And when certain arguments are made to slow down the transition, we should ask ourselves at what price we are willing to accept that.
illuminem Voices is a democratic space presenting the thoughts and opinions of leading Energy & Sustainability writers, their opinions do not necessarily represent those of illuminem.


