A dozen years of Chinese wind, solar and nuclear generation show clear scalability winners

· 10 min read
Two major nuclear generation construction projects have recently declared further delays and cost overruns. As the world’s temperature inexorably heats toward 1.5° and 2.0° Celsius increase landmarks, both of which are very likely to be exceeded, it’s important to ask ourselves, “What form of new generation scales rapidly enough to be of value in the crisis we have allowed to occur?”
After all, every GWh of new low-carbon generation displaces a GWh of high carbon gas or coal generation, so we need to deploy a lot of low-carbon generation quickly to avoid 2.5° and 3.0° of heating, with their far worse impacts around the world.
In the USA, the two reactors at the Vogtle site in Georgia have just announced another cost overrun of $300 million USD, unlikely to be the last, bringing their budget overruns to more than the total original projected cost, $16.3 billion in overruns compared to $14 billion of original budget. The current schedule overrun is at least 9 years over the initial promise of four years. In the UK, the two reactors at the Hinkley site have just announced an additional $3.7 billion USD in cost overruns, and will be commissioned at least another year later. The French Flamanville plant which uses the same reactor technology is also vastly over budget and schedule.
There are multiple assertions that are being used to excuse this disastrous set of results in project delivery. Many Americans assert that there’s too much red tape. Many European nuclear advocates argue that protests by environmentalists are causing significant delays. Both are pointing to COVID-19 as a major factor in recent delays.
If only there were a natural experiment, somewhere in the world, to test these claims, including against the obvious candidates to build instead of nuclear generation, wind and solar. Luckily, there is.
China is a major deployer of wind, solar and nuclear energy. It’s had a nuclear generation deployment program since the 1990s, and wind and solar programs since the middle of the 2000s. Its central government has much greater ability to overcome or simply ignore protests, and to streamline red tape. And it’s been living in the same world with the rest of us for the duration of the COVID-19 pandemic, although it has managed it much better than the rest of the world, with a much lower dip in GDP and far fewer deaths per million citizens. Its results over a dozen years, starting in 2010 when all three programs were mature, should tell the tale of whether nuclear energy, when given every advantage, is more scalable than wind or solar.
In 2014, I made the strong assertion that China’s track record on wind and nuclear generation deployments showed clearly that wind energy was more scalable than nuclear. In 2019, I returned to the subject, and assessed wind, solar and nuclear total TWh of generation, asserting that wind and solar were outperforming nuclear substantially in total annual generation, and projected that the two renewable forms of generation would be producing 4 times the total TWh of nuclear by 2030 each year between them. Last year, I assessed 11 years of wind, solar and nuclear deployments in China
My thesis on scalability of deployment has remained unchanged:
the massive numerical economies of scale for manufacturing and distributing wind and solar components, combined with the massive parallelization of construction that is possible with those technologies, will always make them faster and easier to scale in capacity and generation than the megaprojects of GW-scale nuclear plants.
This was obvious in 2014, it was obvious in 2019, it was obvious in 2021 and it remains clearly demonstrable today. Further, China is the perfect natural experiment for this assessment, as it treats deployments of renewable and nuclear generation as national strategies (an absolute condition of success for nuclear), and has the ability and will to override local regulations and any NIMBYism. No other country could be used to easily assess which technologies could be deployed more quickly with so few confounding factors.
And so, I return to my ongoing analysis of this key question, now with a dozen years of deployment history.
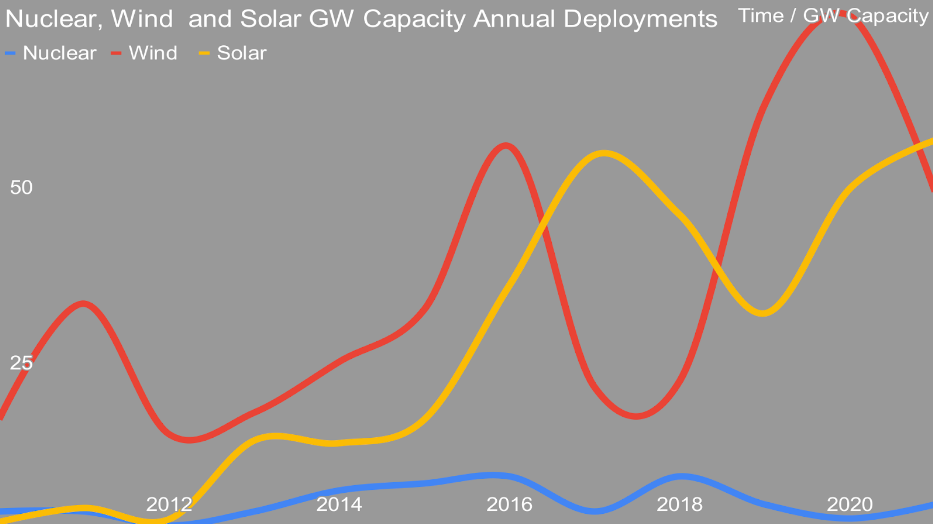
I’ve aggregated this from multiple sources, including the World Nuclear Association, the Global Wind Energy Council, and the International Energy Agency’s photovoltaic material. In 2012, China put no nuclear generation into commercial operation at all. It’s adding more this year, but the year is not complete, and is excluded for all three forms of generation.
The solar and wind programs were started in the mid-2000s, and wind energy initially saw much greater deployments. Having paid much more attention to wind energy than solar for much of the past decade, I was surprised that solar capacity deployments exceeded wind energy in 2017 and 2018, undoubtedly part of why solar doubled China’s 2020 target for the technology, while wind energy exceeded its targets by a substantial but lower amount. I’m less surprised by solar surpassing wind energy in 2021 given the rapid decrease in solar energy costs among other factors.
Nuclear lagged its targets substantially. In 2019, the clear indication was that China would make substantially higher targets for wind and solar, and downgrade their expectations for nuclear, which has been borne out.
As a reminder, COVID-19 was in full flight globally in 2020 and 2021, and yet China managed to deploy as much wind and solar as the rest of the world combined in both of those years. Of course, while much of the rest of the world retires nuclear plants as they face costly refurbishments, China is also succeeding in getting new nuclear plants onto the grid, mostly on schedule and closer to budget. This would appear to suggest that the USA and the UK’s excuses around COVID-19 should be taken with a grain of salt.
This also calls into question the claims of regulatory and protest hindrances. Despite the relative ease of regulatory regimes for nuclear in China, and the low disruptions for any protests, China still delivered far less nuclear capacity than wind or solar. It doesn’t appear that the nuclear industry’s protestations of headwinds stand up to scrutiny.
That said, nameplate capacity doesn’t matter as much as actual generation. Wind and solar energy in China have poorer capacity factors than in the United States and Europe at present. This was assessed in a Letter in the journal Environmental Research by European and North American researchers in 2018.
“Our findings underscore that the larger gap between actual performance and technical potential in China compared to the United States is significantly driven by delays in grid connection (14% of the gap) and curtailment due to constraints in grid management (10% of the gap), two challenges of China’s wind power expansion covered extensively in the literature. However, our findings show that China’s underperformance is also driven by suboptimal turbine model selection (31% of the gap), wind farm siting (23% of the gap), and turbine hub heights (6% of the gap)—factors that have received less attention in the literature and, crucially, are locked-in for the lifetime of wind farms.”
Some of the capacity factor issues are locked in, and some aren’t, but overall wind energy in China’s capacity is below that of the US fleet. For my model, I’ve adjusted capacity factors for wind energy to be 21% in 2010, and rising to 30% for 2021 deployments, still well below US experience. Solar faced some of the same concerns, and as of 2021 had a median capacity factor of 17.6%, which I adjusted down to 15% for early years of deployment, and up to 20% for recent years, again below US experiences.
China’s nuclear fleet has had much better ability to connect to the grid, and as the reactors are new, they haven’t been taken offline for substantial maintenance yet. As a result, the average capacity factor for the fleet of 91.1% for the decade is used.

And this tells the tale. Even adjusted for the poor capacity factor wind and solar experienced and the above global average capacity factor for nuclear, in only one year, 2018, did the nuclear fleet add more actual generation than wind energy. The story is more mixed in the solar vs nuclear story, but since 2016, solar new actual generation of electricity has vastly exceeded that of nuclear. And as a reminder, the Chinese wind and solar deployment programs started well over a decade after the nuclear program, which saw its first grid connections in 1994.
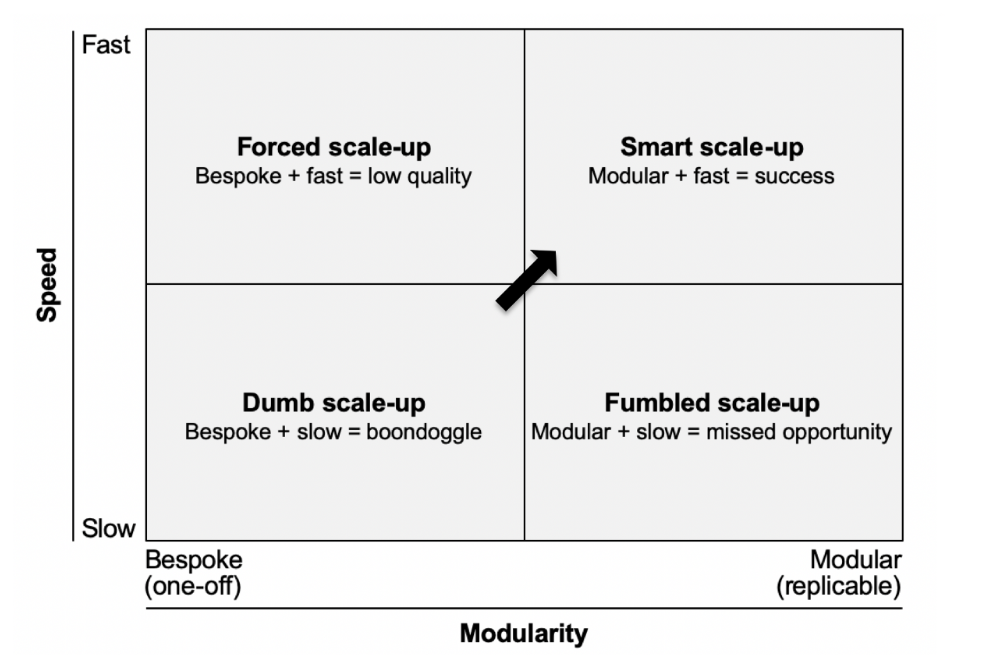
The failures of engineering megaprojects including nuclear generation construction compared to modular projects is a key theme in Dr. Bent Flyvbjerg’s work. Among his roles, he is the First BT Professor and Inaugural Chair of Major Programme Management at Oxford University's Saïd Business School. He’s a global authority on major infrastructure projects. His guidance on how to scale up infrastructure projects effectively is clearly demonstrated by the Chinese experience with the high modular wind and solar farms vs the bespoke singular nuclear plants. I can say this with some certainty, as Flybvjerg and the co-author of his upcoming 2023 book reached out to me to request inclusion of my 2021 analysis in a chapter of that work. Part of my motivation in updating it here is to provide them the best possible version of it.
It’s worth noting that as of today, 7 of the 10 largest wind turbine manufacturers, and 9 of the 10 largest solar component manufacturers are Chinese companies. China remains, as I pointed out a couple of years ago, the only scaled manufacturer of many of the technologies necessary for decarbonization. Further, it’s expanding its market share in those technologies rapidly.
These wind turbine manufacturers have built roughly half of the roughly 400,000 wind turbines and 1.2 million wind turbine blades. They’ve built 80% to 90% of the 3 billion solar panels in the world. These technologies have experienced all the advantages of Wright’s Law, also known as the efficiency curve, which observes that for every doubling of manufacturing volume, unit costs decrease by 20% to 28%. By comparison there are a couple of dozen technologies of varying configurations among the roughly 440 nuclear plants that have been built to date, with each being unique in a variety of ways.
The speed of deployment is a corollary to Wright’s Law, in that not only costs go down, but production speed goes up. Similarly, all along the distribution and construction chain, efficiencies are introduced by innovators and intermediaries for high volume processes. Solar panels, as one obvious example, are shipped in standard shipping containers, but custom ships, train cars and tractor-trailer trucks deliver wind turbine components globally.
My 2014 thesis continues to be supported by the natural experiment being played out in China. While working on my of assessment of small modular nuclear reactors, it became clear to me that China has fallen into one of the many failure conditions of rapid deployment of nuclear, which is to say an expanding set of technologies instead of a standardized single technology, something that is one of the many reasons why SMRs won’t be deployed in any great numbers.
Wind and solar are going to be the primary providers of low-carbon energy for the coming century, and as we electrify everything, the electrons will be coming mostly from the wind and sun, in an efficient, effective and low-cost energy model that doesn’t pollute or cause global warming. Good news indeed that these technologies are so clearly delivering on their promise to help us deal with the climate crisis. But of course, policy makers must pay attention to the on the ground results.
illuminem Voices is a democratic space presenting the thoughts and opinions of leading Energy & Sustainability writers, their opinions do not necessarily represent those of illuminem.
Jonathan Lishawa

AI · Energy Transition
Olaoluwa John Adeleke

Power Grid · Power & Utilities
Alex Hong

Energy Transition · Energy
Financial Times

LNG · Oil & Gas
Oil Price

Renewables · Energy
Forbes

Energy Transition · Energy Management & Efficiency