
· 12 min read
Levelized costs of electricity often dominate the energy and climate debate. Green advocates like to believe that if we only invest enough in wind and solar, the resulting cost reductions will soon put an end to fossil fuels. While this is already a strongly oversimplified viewpoint, a narrow focus on cost makes such simplistic analyses even less useful.
This article will elaborate by example of two clean energy technologies that face very different non-economic barriers: nuclear and wind.
The Nuclear Stagnation
When technology is new and exciting, people only see the positives. It’s only when we reach meaningful market shares that undesired impacts are felt, and public opinion turns negative.
In the case of nuclear, the global expansion was handicapped by the Chernobyl disaster in 1986, and the nascent developing world expansion was interrupted by Fukushima in 2011. As shown in Figure 1, Chernobyl happened when nuclear reached about 5% of the global energy supply. Today, we are at 4.2%.
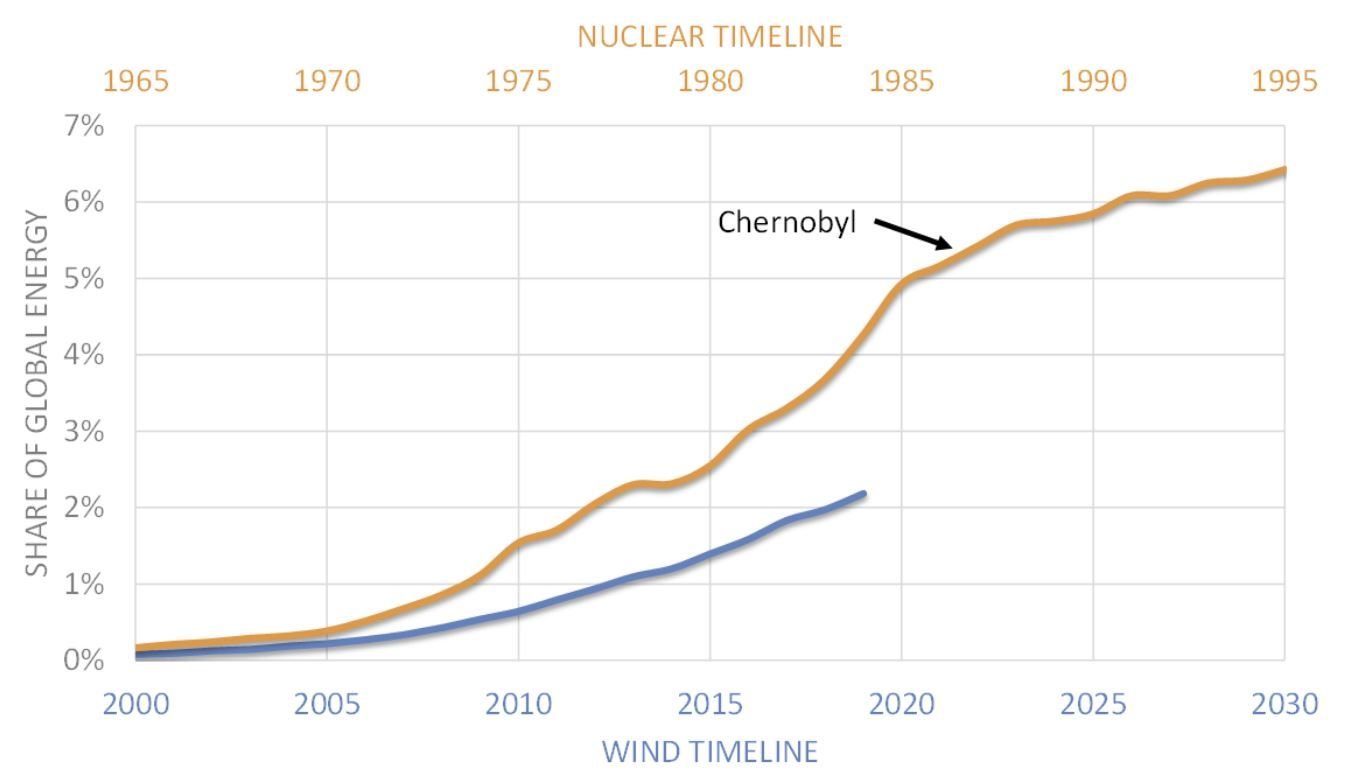
Figure 1: Comparison of the global expansion of wind and nuclear from BP Statistical Review data. Both wind and nuclear electricity output are multiplied by 2.5 to convert it to displaced primary fossil energy.
Deaths from Chernobyl are estimated somewhere between 4,000 and 60,000, with 574 for Fukushima. For perspective, it is estimated that one future premature death results from every 300 to 3000 tons of burnt carbon or 1100 to 11000 tons of CO2 released into the atmosphere. Hence, if we assume that the 93,000 TWh of nuclear power generated to date displaced coal at 0.8 ton-CO2/MWh, the 74 billion tons of CO2 avoided by nuclear has already saved 7–70 million lives, not counting the additional impact of avoided air pollution.
Nuclear has already saved 7–70 million lives, not counting the additional impact of avoided air pollution.
Clearly, the public backlash against nuclear was not rational from a big-picture view. But that doesn’t matter. The effects of public resistance are real, whether it’s rational or not.
A Wind Stagnation?
As Figure 1 shows, wind is currently expanding at about half the pace of nuclear in the seventies and eighties. Although wind does not face risks from black swan events like nuclear, it faces its own brand of public resistance, both to the turbines themselves and the large network expansions required to integrate higher wind shares.
As our societies become more advanced, we increasingly demand an invisible energy system. Over here in Norway, the usually reserved population is reacting furiously to onshore wind expansion plans. Turbines dotting the pristine Norwegian landscape are simply unimaginable to this wealthy society, the origin of its wealth notwithstanding. In Germany, resistance to turbines and grid expansions has almost brought onshore wind expansion to a halt at levels around 7% of total energy demand.
Wind’s greatest challenge: It’s the most visible energy technology we have.
That is wind’s greatest challenge: It’s the most visible energy technology we have. As wind continues to expand and turbines grow ever larger, its visibility will only grow while society’s tolerance for highly visible energy technologies continues to decline. Advanced societies also become increasingly concerned with nature preservation, leading to additional hurdles related to bird protection.
Offshore wind can help, but it will need to be built far from shore to be sufficiently invisible, making it more costly. It also faces further economic challenges from wake effects that strongly reduce output as total installed capacity increases. In addition, offshore wind requires large grid expansions to serve inland regions. Making these expansions invisible (underground cables) is very expensive.
Like nuclear, this resistance is not rational from a big-picture viewpoint. Surely, seeing the occasional wind turbine in the wild is worth the climate benefits. But again, the rationality of this resistance doesn’t matter. What matters is the effect it has on clean technology deployment.
The Undervalued Issue of System Complexity
Megaprojects that involve many interconnected technical, economic, political, and social challenges are extremely difficult to execute on time and within budget. Nuclear offers a prime example with many stories of budgets and timelines that were widely missed, increasingly stringent safety regulations being only one reason.
In comparison, the modular construction and installation of a wind turbine is child’s play. For decades, the simple and standardized construction and installation of wind and solar have been a big driver behind their impressive growth and falling costs.
In comparison to a nuclear plant, the modular construction and installation of a wind turbine is child’s play.
But this will not last. Higher wind market shares require vast grid expansions (often into neighboring countries) and lots of integration with other sectors that previously operated independently. In the longer term, this includes a large hydrogen transport, storage, and end-use sector that needs to be built from scratch. Executing this enormous integrated project in a shifting policy-technology landscape with impossibly tight climate timelines and increasing public resistance can easily surpass the scale and complexity of nuclear projects.
As the nuclear example shows, sub-optimal execution is to be expected in such a large, complex, and multifaceted project, inflating overall system costs and slowing the energy transition.
These effects are quantified using a published energy systems model below.
Model Results
The coupled electricity-hydrogen system model is run for different cost assumptions for wind transmission and nuclear plants:
- Wind transmission costs are increased relative to the baseline assumption of €300/kW to account for the factors discussed above
- Nuclear costs are varied from €2000/kW (perfectly executed project in a welcoming market) to €8000/kW (complex execution in the West)
Scenarios with and without CO2 capture and storage (CCS) are included. In each scenario, the model optimizes investment and hourly dispatch of all the technologies listed in the Appendix of this article to minimize total system costs. A high CO2 price of €200/ton is assumed in all cases.
The Energy Mix
Electricity production and consumption from the optimal technology mixes for different cases are shown in Figure 2. Starting from the left, we see that higher wind transmission costs strongly reduce the deployment of wind power in the optimal energy mix. With the base costs (€300/kW), almost all required hydrogen is made locally using electrolysis. However, this scenario requires 250 GW of installed wind capacity — quadruple the current installed base in Germany where public resistance is already having a large negative impact on wind expansion plans.
The base scenario requires 250 GW of installed wind capacity — quadruple the current installed base in Germany where public resistance is already having a large negative impact.
When wind transmission costs are tripled, almost all hydrogen needs to be imported as green ammonia. Quadrupling of costs to €1200/kW (about the same as the turbine costs) brings substantially more unabated gas power plants into the generation mix despite the high CO2 price of €200/ton. Solar power is cheap, but its role remains limited due to the large seasonal variation and mismatch with the seasonal electricity demand profile.
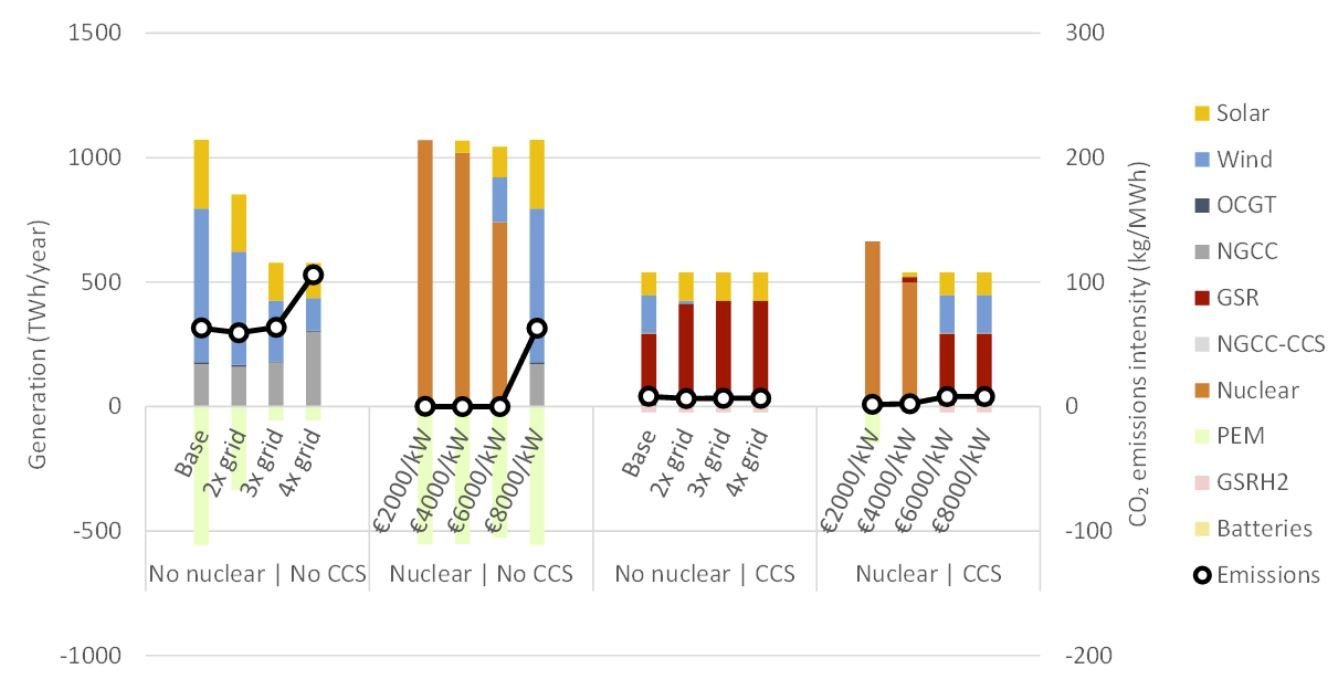
Figure 2: Optimal electricity generation and consumption in the different cases. OCGT = open cycle gas turbine; NGCC = natural gas combined cycle; GSR = gas switching reforming; CCS = with CO2 capture and storage; PEM = polymer electrolyte membrane electrolysis. GSRH2 = electricity consumption by GSR when producing hydrogen (Source)
Allowance of nuclear into the system creates a 100% nuclear system when nuclear projects are perfectly executed (€2000/kW). Even at a cost of €6000/kW (triple the technical potential), nuclear still dominates. However, at €8000/kW, costs become excessive, and the optimal solution is the same as the base case in the scenario without any nuclear.
When CCS is allowed into the system, the GSR technology starts playing a large role. Electricity demand is also much lower because all hydrogen is generated using natural gas reforming that only consumes a small amount of electricity using the GSR technology. When grid costs are doubled, wind is pushed out of the optimal technology mix.
In a scenario with both nuclear and CCS allowed, nuclear remains responsible for essentially all the power production up to €4000/kW plant costs. However, GSR is still responsible for generating most of the hydrogen. When nuclear costs are inflated to €6000/kW, nuclear is pushed out of the system, and the optimal mix reverts to the base case in the scenario without the availability of nuclear power.
Total System Costs
The minimized annual system cost of each case is shown in Figure 3. For the scenario without nuclear or CCS, the base case shows that direct costs of renewables account for only about 40% of total system costs, even though they supply 83% of total energy, illustrating the high system costs of integrating such high shares of variable renewables and producing a large quantity of green hydrogen. When grid costs are increased, more hydrogen is imported in the form of green ammonia (included in “Other” costs). The system-scale levelized cost of energy is high in this scenario, ranging from 120–133 €/MWh.
The direct costs of renewables account for only about 40% of total system costs, even though they supply 83% of total energy, illustrating the high system costs of integrating such high shares of variable renewables.
The ideal nuclear case (€2000/kW) reduces costs by more than half. For perspective, the difference between the cases with and without €2000/kW nuclear is about 2% of German GDP — twice the GDP growth rate since the turn of the century. However, total system costs rise steeply as nuclear plant costs increase. The system with €6000/kW nuclear is only about 10% cheaper than the case without nuclear.
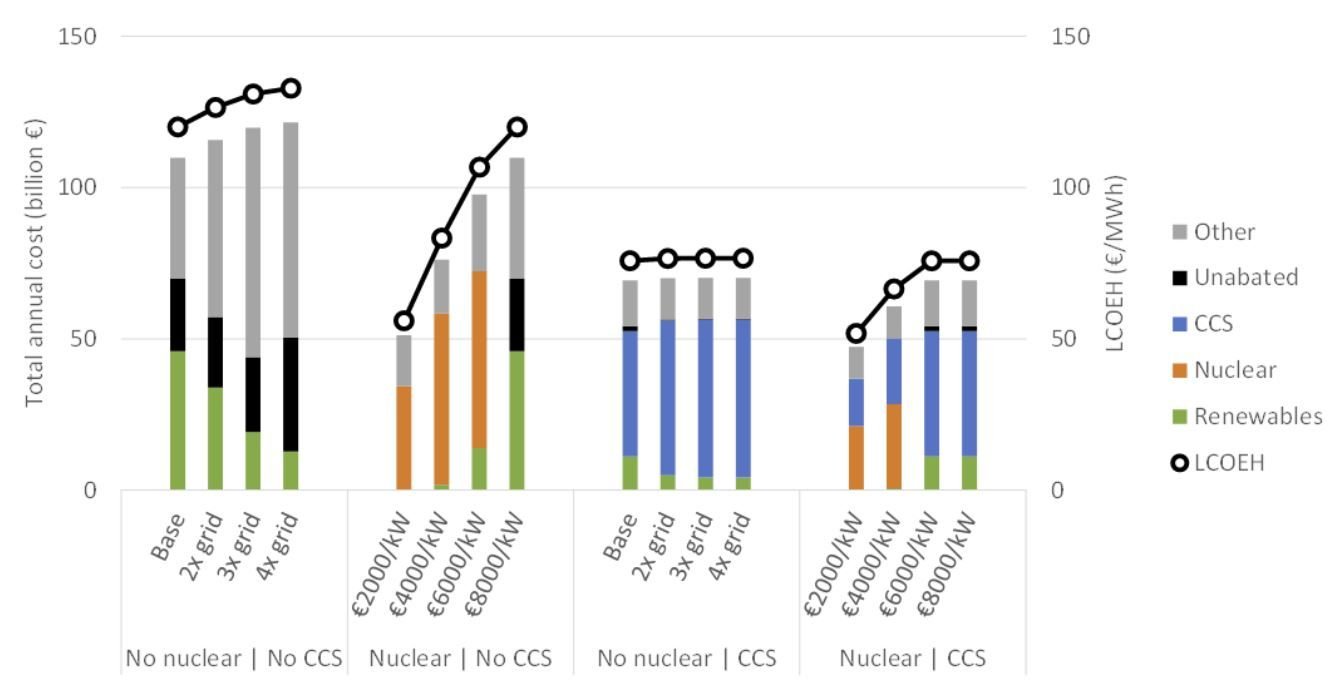
Figure 3: Optimized costs of the energy system in the different cases. LCOEH = levelized cost of electricity and hydrogen. “Other” costs are broken down in Figure 4.
The addition of CCS reduces costs substantially when nuclear is not allowed. It also prevents any significant cost increases when wind is rendered uneconomic by rising grid costs. However, a system that is so dependent on natural gas is undesirable, and substantially higher shares of renewables and nuclear would be preferred from the perspective of energy security and long-term sustainability.
When combined with nuclear, CCS can slightly reduce system costs by taking care of hydrogen production via reforming. The benefit of this blue hydrogen becomes larger when nuclear costs increase from 2000 to 4000 €/kW, and CCS also takes over in the power sector when nuclear plants cost €6000/kW.
Other System Costs
More insights about the other (not energy supply) system costs are given in Figure 4. The transmission cost that is increased in the wind cases is the “VRE transmission” component. As grid costs are increased, the system limits this cost by importing more hydrogen in the form of green ammonia instead of generating it from local wind power. Clearly, the cost of these green ammonia imports grows very large in cases with high wind grid costs.
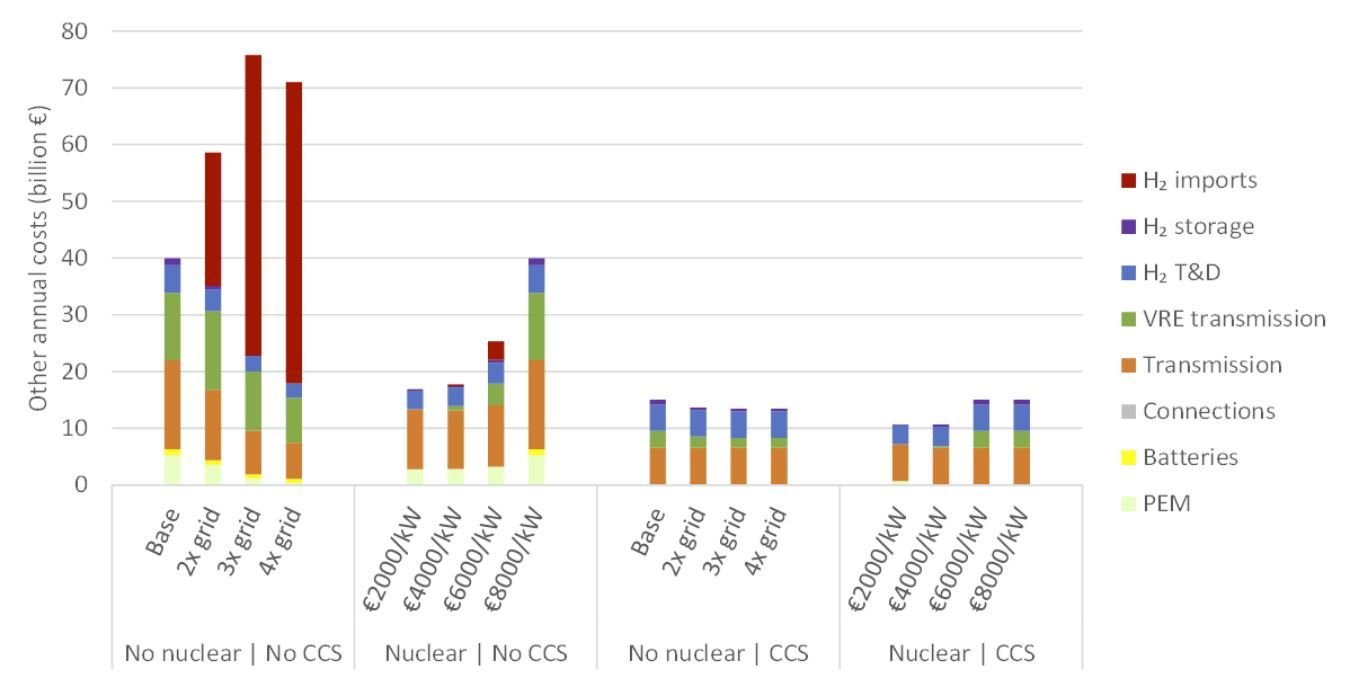
Figure 4: Outline of the “other” costs in Figure 3. T&D = transmission and distribution; VRE = variable renewable energy; PEM = polymer electrolyte membrane electrolysers.
The simplified energy system facilitated by nuclear is also clearly visible. Electrolyser costs are lower due to the possibility to operate electrolysers at maximum capacity factor from the steady supply of nuclear power, and no battery storage is needed. Grid costs are also lower because nuclear plants can be constructed where energy demand is highest. Hydrogen transmission and storage costs also reduce because hydrogen is produced at steady state.
Cases with CCS simplify the system further, mainly because no electrolysers are needed and the electricity grid can be smaller.
Conclusions
An over-reliance on wind can be just as challenging as an over-reliance on nuclear. The socio-political hurdles facing wind and nuclear are very different, but both are highly significant. As wind continues to expand to the level where nuclear peaked (it’s currently about one-third of the way there), public resistance and system complexity will continue to mount, causing substantial headwinds.
As wind continues to expand to the level where nuclear peaked, public resistance and system complexity will continue to mount, causing substantial headwinds.
Ultimately, wind will follow the same S-curve deployment pattern of all other energy technologies, but the plateau may well come earlier than proponents believe. For this reason, nuclear and CCS should be encouraged for parallel deployment, especially in regions with limited and/or seasonal solar availability. The ability to construct these technologies where energy is demanded and dispatch them according to demand results in a much simpler energy system.
An all-of-the-above approach to the energy transition guided by technology-neutral policies remains the rational choice. Each technology class has its limits and weaknesses, and we need a balanced mix to allow each technology to do what it does best. Wind and solar are great at moderate deployment levels, but other clean technologies will be needed to reach net-zero. Nuclear is one of these options, while CCS has an important role to play in system balancing and clean fuel provision.
Each technology class has its limits and weaknesses, and we need a balanced mix to allow each technology to do what it does best.
The global energy transition is a clean energy team effort. All the players deserve our support.
Appendix: Model Description
The energy systems model discussed in a previous article is used in this study to illustrate the large effects of cost inflation caused by the range of techno-socio-economic factors discussed above. The model is loosely based on Germany and is designed to optimize investment and hourly dispatch of a range of technologies, including:
- Eleven different electricity generators: onshore wind, solar PV, nuclear, pulverised coal, and natural gas combined-cycle plants with and without CCS, open cycle gas turbine peaker plants, hydrogen combined and open-cycle plants, and the novel gas switching reforming (GSR) concept
- Lithium-ion batteries for electricity storage
- Three clean hydrogen generators: GSR, steam methane reforming (SMR) with CCS, and polymer electrolyte membrane (PEM) electrolysis
- Two hydrogen storage technologies: cheap salt caverns with slow charge/discharge rates and locational constraints and more expensive storage tanks without such limits and constraints
- Hydrogen can also be imported in the form of green ammonia that is reconverted to hydrogen in reconversion plants included in the model
In addition, transmission costs for electricity and hydrogen are included in the model. In this assessment, the transmission costs for wind (set to €300/kW in the base case) will be increased to assess the effects of cost inflation caused by factors such as:
- The need to build turbines in more isolated sites or far offshore to satisfy local stakeholders
- Avoiding public resistance to grid expansions via expensive underground transmission lines
- Having to resort to sites with lower quality wind resources
- Paying fees to local communities to allow the construction of turbines closer to demand
- A sub-optimal buildout of the complex and highly interdependent systems required to integrate high shares of wind
In addition, the effect of cost inflation of nuclear power will be investigated by changing nuclear plant capital costs between €2000/kW and €8000/kW. The lower bound represents well-executed nuclear projects in more welcoming environments like China and South Korea. The upper bound accounts for the vast complexity and inefficiency of constructing nuclear plants in the West.
These variations are investigated in scenarios with and without CCS allowed into the system using a high CO2 price of €200/ton to incentivize low-carbon technologies.
In all cases, total annual electricity demand is set to an hourly fluctuating profile for Germany in 2012, requiring a total of 515 TWh of production per year. In addition, a flat demand for hydrogen of 400 TWh/year is included. This is equivalent to about a quarter of German non-power oil & gas consumption, implying that much more clean energy will be needed for net-zero emissions.
Energy Voices is a democratic space presenting the thoughts and opinions of leading Energy & Sustainability writers, their opinions do not necessarily represent those of illuminem.


