The imperative of economic development in energy transitions


· 5 min read
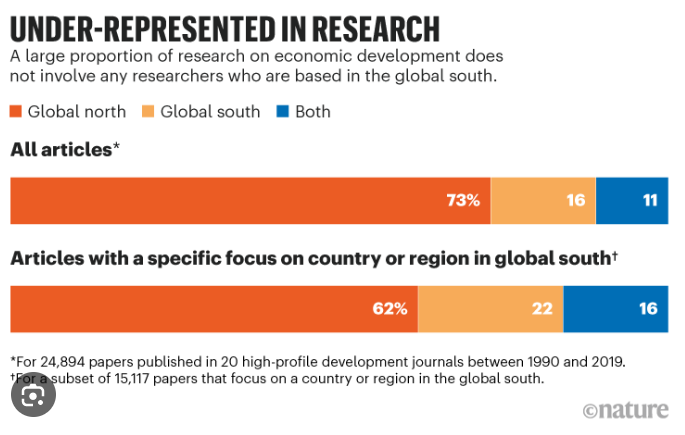
The need to highlight discrepancies in carbon emissions and the ineffectiveness of the idea that a single solution can be implemented across the world has been brought into discussion and challenged. There are many problems with the current narrative surrounding energy transitions but one of the most significant and that retains a high degree of relevance to the developing countries or Global South is what I call the imperative of economic development in the debate(s) of energy transitions.
There is a direct correlation between economic growth and carbon emissions at least to a certain extent. Vaclav Smil in his book How the World Really Works explores this in detail when he mentions that the current debate about energy transitions does not include the alternative to the 4 pillars of modern civilization: Cement, steel, plastic and ammonia, plastic, steel and cement.

The following observations are from his book and add to this debate in a very constructive manner: In order to achieve decarbonization at a global scale by 2050 we will have to pull off a significant global economic withdrawal or depend on exceptionally swift changes reliant on technological breakthroughs. But once again we return to the debate of developed vs developing countries. It is important to note that in 2020, the average annual per capita energy supply for approximately 40 percent of the global population (3.1 billion individuals, encompassing almost everyone in sub-Saharan Africa) was equivalent to what both Germany and France enjoyed in 1860s. To imitate that standard of living these 3.1 billion individuals must strive to at least double, if not triple, their per-capita energy consumption. This is required mostly in the fields of electricity access, ensuring food production, and establishing infrastructure. However, this will also result in increased carbon emissions.
Optimistic scenarios estimate a fall of 52 percent in average global per capita energy demand by 2050 as compared to 2020. However, it is important to recognize that reducing per capita energy demand by half within a span of three decades would be an extraordinary achievement, especially considering that global per capita energy demand had actually increased by 20 percent in the preceding 30 years.
The assumption is a twofold increase form of transportation in the next 30 years in Global South along with a threefold jump in ownership of consumer goods. China is pivotal in this regard and acts as a good case study as in 1999 it had about 0.34 cars per 100 urban households but by 2019, this number had surged to over 40, an increase of more than a hundredfold in just two decades! Similarly, in 1990, only one out of every 300 urban households in China possessed an air conditioning window unit. By 2018, however, this figure had skyrocketed to 142.2 units per 100 households, signifying a remarkable rise of over 400 times in less than three decades.
According to another calculation, mentioned by Smil in his book, the removal of 0.9 billion to 1.7 billion tons of CO2 annually would be required to achieve Net Zero in 2050. This would only be possible by establishing an entirely new industry for capturing, transporting, and storing gases would need to be established. This industry would need to handle a volume 1.3 to 2.4 times greater than the current U.S. crude oil production every year. It is worth noting that the development of the crude oil industry took over 160 years and trillions of dollars to build. There is an eminent need to establish such industries that can ensure the reduction of carbon emissions especially among the developed countries as they pose a grave threat to the collective wellbeing of mankind.
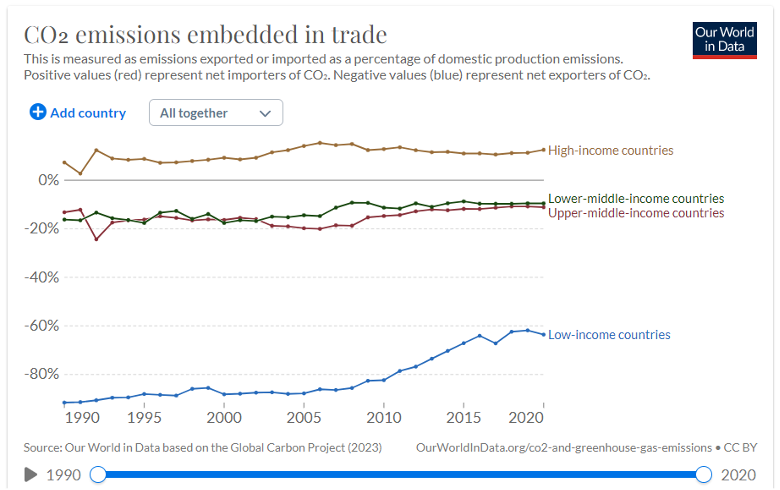
I will write another piece on Smil’s book and the highly insightful reality checks therein. But to return to the topic consider the following chart by Our World In Data which also highlights the discrepancy referred to at the start of the article and cements the case for the developed countries reducing their emissions faster than the developing ones. For instance, the UK imported 41 percent of its domestic carbon emissions which is an 11 percent increase from the 1990s. From 1990 to 2019 the country has reduced its emission only by 1.2 percent on an annual basis versus the target of 3.3 percent.

The following chart shows the carbon intensity per person. See all the thronged areas aren’t in Africa or South America. Also, the figures are much higher for the U.S. than China despite its population being 4.35 times lesser!

Source: Global Carbon Atlas
In the chart below we can see the division of CO2 emissions territory-wise.

Source: Global Carbon Atlas
Interestingly, the implications of the Global North & South debate are not confined to the biosphere degradation of the planet; they penetrate deeper than that. They deeply impact the economic landscape of the world and influence the parameters of its success in today's globalized world. Addressing these implications requires acknowledging and working to rectify historical and structural inequalities, promoting active participation of the Global North and supporting sustainable and inclusive economic development initiatives in the Global South.
illuminem Voices is a democratic space presenting the thoughts and opinions of leading Sustainability & Energy writers, their opinions do not necessarily represent those of illuminem.
illuminem briefings

Public Governance · Social Responsibility
illuminem briefings

Public Governance · Social Responsibility
illuminem briefings

Public Governance · Social Responsibility
Financial Times

Carbon Market · Public Governance
The Guardian

Pollution · Nature
Politico

Public Governance · Social Responsibility