The energy transition already happened
 UnsplashUnsplash
· 10 min read
Renewable energy provides most of the electricity in nearly the entire Western US: South Dakota (92%, 60% of which is wind), Iowa (83% wind), Nebraska (74% wind), Kansas (74% wind), New Mexico (67% wind), Wyoming (57% wind) Oklahoma (54% wind), North Dakota (51% wind), Nevada (46% wind and solar), and the important markets in California (43% wind and solar), Colorado (43% wind), and Texas (34% going on over 40% in 2025, wind and solar)1,2,3. Remarkably, wind and solar are already cheaply powering roughly half of the contiguous US and doing so cheaply and reliably.
Renewable generation in America is a success story of low cost, reliable, native to the US power, resulting in American energy dominance and energy independence. Renewable power also employs more Americans than oil and gas extraction and is a huge contributor to the American economy – employment, economic activity, local community benefits, including rent and property taxes, impact on lowering power prices, etc.
We have flooded power markets with cheap wind and solar – and know the outcome: prices go down and reliability goes up. This article will focus on reliability. I have been in the power business since the 1990s and never would have predicted this remarkable outcome, which far exceeds any expectation.
I hear all the time, “America needs reliable energy …”.
America does have reliable energy in all of these renewable energy-powered states – the lights are not going out in half of the United States. America has proven beyond any measure that wind and solar provide not only the cheapest source of power, but also that renewable resources have improved reliability.

Figure 1: Wind and solar by state4
The Western US is not an anomaly; renewables are becoming the most prevalent source of electricity worldwide. China is building ten times the amount of solar in 2025 that we are building here in the US. China is the largest generator of wind and solar power. There are nine countries that source between 35% and 70% of their power from wind and solar: Denmark, Djibouti, Spain, Germany, Uruguay, the UK, Lithuania, Ireland, and Portugal. Around the world, and here in the US, wind and solar are cheaply and reliably powering the US and global economy. To claim that wind and solar are not reliable ignores vast experience, both here in the US and internationally. Wind and solar are becoming the dominant sources of electricity worldwide.

Figure 2: Global electricity production5
Power markets and electricity grids are highly specific and hard to generalize. Different markets maintain reliability in different ways. But fundamentally, the variable that changes the most in any power grid daily is load – electricity is generally used during the day and much less so during the night. The same applies seasonally: power demand fluctuates significantly throughout the year, so grids are designed to meet peak demand, even though those peaks only occur for a few hours annually.
Most of these high-renewable-consumption states have significant transmission connections, in many cases to dozens of other states. Some of these states have significant fossil generation that is both old, in many cases over 40 years old, economically obsolete, and only operates for a few hours annually to meet peak load. Other states have significant hydro, geothermal, or nuclear generation. In every case where renewables exceed 35% of all generation – across the entire Western US - the lights have stayed on, price volatility decreased, and seemingly paradoxically, reliability has improved.
It is a much-repeated myth that each city or state needs a “real” or fossil power plant to provide its load 24x7x365 – and therefore that each wind turbine would need a fossil power plant standing by to provide service when the wind does not blow, or in the case of solar, after the sun sets. Iowa is 85% wind-powered, for example. There is existing infrastructure, battery projects help considerably, and there is generally significant transmission interconnectivity to facilitate a highly reliable yet renewable powered grid.
Power professionals use seemingly impenetrable language to describe the operation of power grids and markets, and in many cases provide considerable technical information, but fail to bridge the information to meaningful information to the public and policy makers.
Fundamentally, when there is a shortage of energy, market prices go up – there is a shortage. Grid operators pay money to generators and other grids for “ancillary services” which provide reliability through voltage support and immediate standby power generation. Grid operators also pay “reliability payments” for generation to be available when the grid operator is concerned about a shortfall.
Therefore, the amount of electricity shortage can be measured in transparent markets by the energy price, the cost of ancillary services, and reliability costs. In fully regulated markets, the analysis tends to be very situational and opaque.
Wind and solar power half of America, how did renewables do? Did prices go up or down? Are reliability payments going up or down? In transparent markets such as California’s CAISO and Texas’s ERCOT, clearly, renewables lowered power prices and decreased reliability costs.
Iowa represents an interesting case given the twenty-plus-year experience and amount of wind on its system. Iowa represents a case where the investor-owned utilities are fully regulated. The state generated 83% of all generation by wind power in 2024. Iowa’s largest utility is Warren Buffett-owned MidAmerican Resources who reports that the state’s pro-renewable policy “allowed Iowa to be an early adopter of renewable generation technologies." That, in turn, has been a key competitive advantage for the state’s economic development efforts and directly resulted in [retail] rates that are 26% lower than the national average among investor-owned utilities…. The result of that 20-year investment in renewables is more than 3,400 wind turbines in operation across 32 Iowa counties, positioning MidAmerican as the owner and operator of more wind energy than any other rate-regulated utility. The focus on renewables has created a shift in how energy is generated. In 2023, wind and solar energy accounted for "60.5% of the company’s owned energy production.”6,7 An examination of the MidAmerican Resource Plan provides a roadmap for the management of this high penetration of renewables, which are forecast to grow even further under their recommended plan.

Figure 3: MidAmerican generation capacity8
Most power in Texas is generated in a deregulated market whose grid operator is called ERCOT9. Given the large market, the material amount of renewables, and the market transparency, Texas makes an excellent case study, and the impact of renewables on reduced reliability costs by over $10 billion per year – the Texas grid got more reliable as wind and solar started to dominate the market in 2023 and 2024. As wind and solar flooded the Texas market and went over 35% of all power generated in Texas in 2024, power prices dropped from an average of $70 in 2023 to $34 in 2024, saving Texans around $18 billion year over year10. Texas is headed toward 40% of all power generation from wind and solar in 2025, and power prices have continued to decline. To recap, as wind and solar started to flood the Texas market, prices went down, volatility went down, and reliability costs went down.


Figures 4 and 5: ERCOT renewables build out, all in power costs in ERCOT 2020 through 202410
The following ERCOT market performance dashboards are representative of system performance. On a Friday in August, solar and wind at their peak provided 45% of all Texas generation. ERCOT forecasts system capacity for the day or the amount of generation resources available and the system's anticipated load or demand. Notice the degree to which demand changes, the tracking of generation by fuel, the result of a typical day is presented on the far right – wind and solar being the main drivers of peak demand hours.

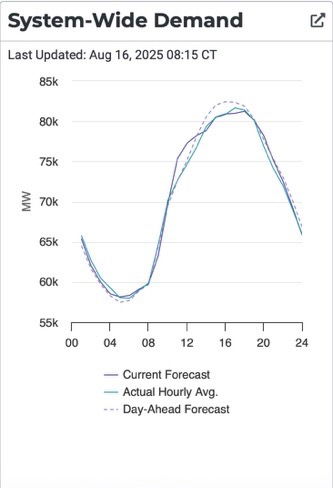


Figure 6: ERCOT market dashboards11
Comments on the notable event of the winter story Uri in Texas. In February 2021, Texas was hit by very cold weather, below 0°F/ -17 °C in some cases12. This storm caused widespread and multi-day power outages, and over 200 deaths are attributed to the storm13. The cause of this outage was thoroughly investigated by many, and generally, the entire natural gas fuel production, midstream treatment, and pipeline systems were not designed for this weather, and several failures were experienced. Additionally, outdoor fossil power plants were not winterized to operate in this weather and failed to perform14. Wind was not the cause15. Additionally, there are three times wind and solar on the Texas ERCOT grid at the end of 2025 than there was in February 2021.
California is seeing similar results to Texas. As renewables continue to ramp in California, 2025 power prices are $37/MWHR, down 39% from the same period in 202416. Solar and wind flooded the market along with batteries, prices went down, and reliability improved. Wind and solar generation increased 33% from 1Q24 to 1Q25. There are no fossil generators in standby 24x7x365; nevertheless, the lights didn’t go out – far from it: prices dropped (indicating no scarcity value), and the cost of reliability services (or standby power) went down. The large interconnected Western power grid includes winter and summer peaking regions and a variety of generation types which the grid operators use to manage their variable resources while maintaining reliability.

Figure 7: The North peaks in the winter, the South peaks in the summer, thereby creating efficiencies17
When additional resources are needed, California calls on mostly batteries and hydro resources.

Figure 8: Resources used to balance the grid as load changes17
And overall reliability costs have decreased dramatically. See the reduced number of events in 2025 vs. prior periods.


Figures 9 and 10: chart of high prices in the market, decreasing from 2024 to 2025; the number of power plants needed to be in reserve decreases from 2024 to 202517
As noted in the 2025 Q1 Report on Market Issues and Performance, “no reservations were made for CAISO balancing …” and “real-time resource adequacy bids were sufficient to cover the market requirements …” Meaning the need to spend money on standby generation decreased annually despite adding considerable renewable resources to the generation mix.

Figure 11: The generation mix in California during 1Q25: a system heavily dependent on variable resources, producing a low-cost, highly reliable overall operation17
Across the three markets examined, each with wind and solar between 40% to 85% of all generation, there is increased reliability and lower costs. Each of these markets has different market structures and maintains reliability in different ways. Nonetheless, America has a very observable outcome of adding significant wind and solar to power grids: low cost, reliable power. These results are surprising to me, but the results are in, and wind and solar are clearly an important American natural resource capable of producing energy dominance. Globally, similar success is also being observed.
illuminem Voices is a democratic space presenting the thoughts and opinions of leading Sustainability & Energy writers, their opinions do not necessarily represent those of illuminem.
Track the real‑world impact behind the sustainability headlines. illuminem's Data Hub™ offers transparent performance data and climate targets of companies driving the transition.
1. EnvironmentAmerica hosts very useful summary of public source information,
https://environmentamerica.org/center/resources/the-state-of-renewable-energy-dashboard
2. Electric Power Monthly, US Energy Information Administration, February 2025
3. ERCOT 2024 State of the Market Report, Potomac Economics, May 2025
4. EnvironmentAmerica 2025
5. Ember-energy.org
6. Resource Evaluation Study Report, November 2024, MidAmerican Resources
7. Note, the 85% data is in 2024 generation, the Resource Evaluation Study reports 2023 wind projects as capacity: therefore, the discrepancy between 2023 wind capacity of 60% and 2024 wind generation of 85%
8. MidAmerican 2024
9. ERCOT means the Electricity Reliability Council of Texas, see www.ercot.com
10. Potomac 2025
11. www.ercot.com accessed August 16, 2025
12. Final Report on February 2021 Freeze Underscores Winterization Recommendations, Federal Energy
Regulatory Commission, November 2021
13. https://comptroller.texas.gov/economy/fiscal-notes/archive/2021/oct/winter-storm-impact.php
14. https://www.iaee.org/eeep/eeepexec/eeep12-2-ExecutiveSummaries.pdf
15. Searcey, Dionne (February 17, 2021). "No, Wind Farms Aren't the Main Cause of the Texas
Blackouts". The New York Times. ISSN 0362-4331. Retrieved February 18, 2021
16. Q1 2025 report on Market Issues and Performance, California independent System Operator, June
2025
17. CAISO June 2025
illuminem briefings

Solar · Sustainable Mobility
illuminem briefings

Solar · Renewables
illuminem briefings

Solar · Renewables
Electrek

Solar · Renewables
First Post

Agriculture · Solar
E&E News

Renewables · Solar