Renewable energy products are not 100% clean

· 6 min read
Renewable energy comes from natural sources that replace themselves more quickly than they are used up. There are many distinct types of renewable energy available, such as sunlight, wind, biomass, etc. Conversely, fossil fuels like coal, oil, and gas require hundreds of millions of years to create. When fossil fuels are used to create energy, they emit dangerous greenhouse gases (GHG) like carbon dioxide (CO2)7 which, once it’s released into the atmosphere, stays between 300 to 1000 years1. More GHG is emitted by burning fossil fuels than by producing energy products from renewable sources.
Examining the life-cycle emissions of energy technologies is crucial. These emissions relate to the overall emissions emitted during the production of an energy technology, including emissions from mining, manufacture, installation, maintenance, and disposal. To take into consideration the several sources of emissions, this is quantified in grams of CO2 equivalents (See Figure 1). The figure below compares the CO2 emitted in gCO2 emissions/kWh by wind turbines during their construction and their lifespan (20–30 years) which is compared by other types of power generation6.
Figure 1. Lifecycle grams of CO2 emissions per kWh (gCO2e/kWh)
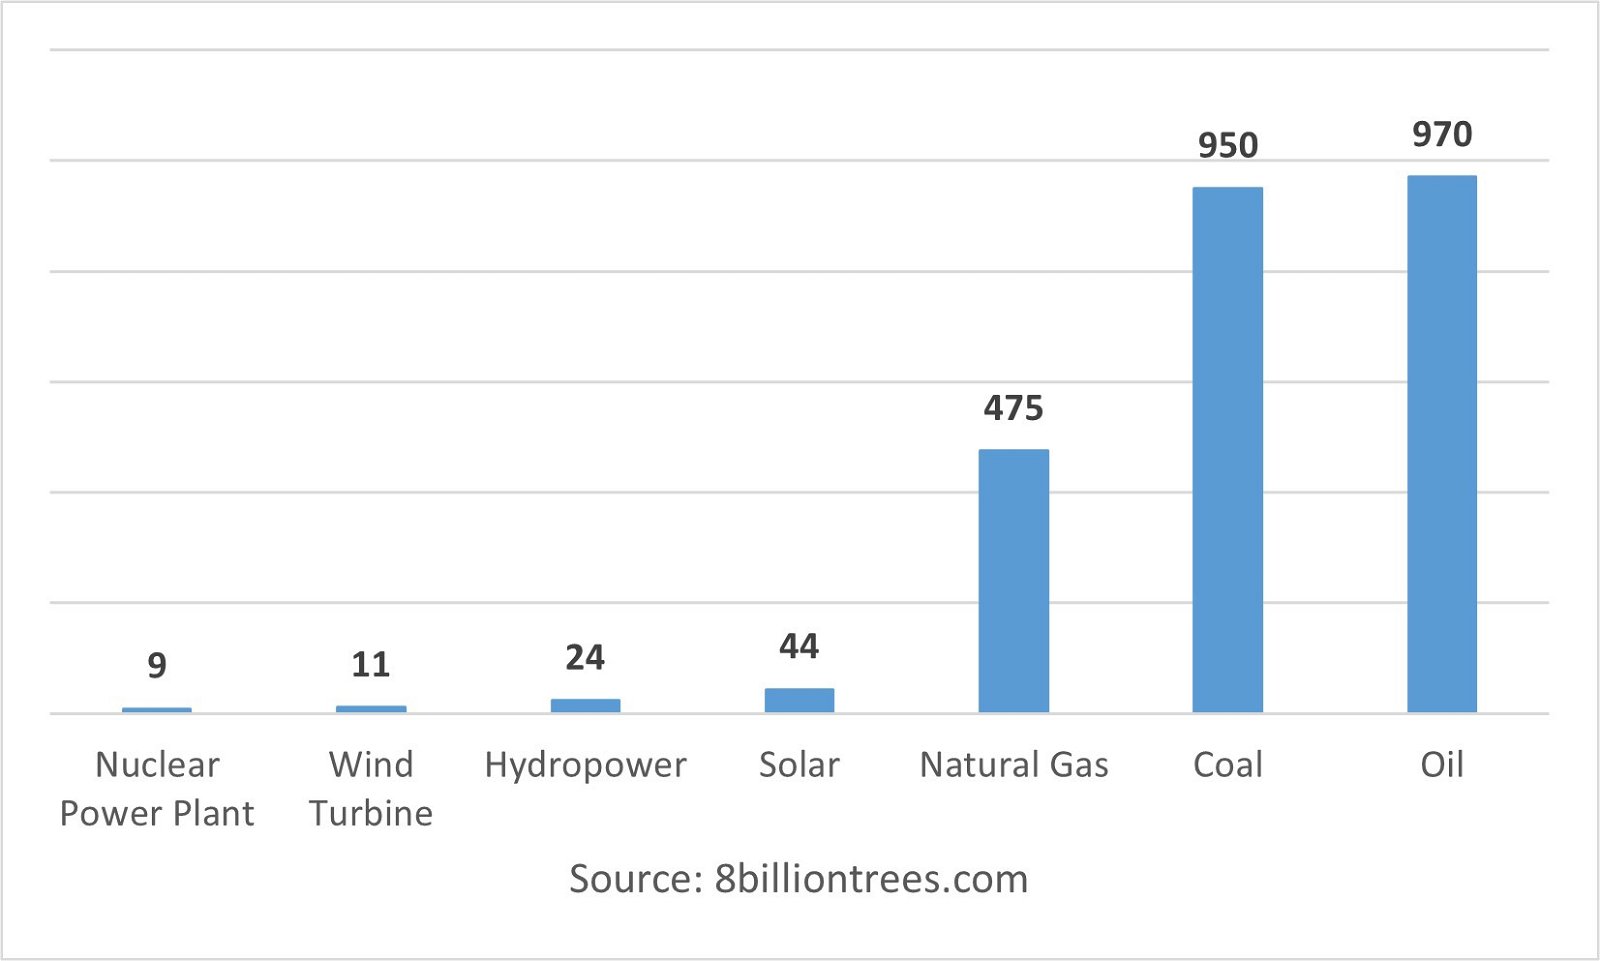
According to the figure, for a solar system with a 30-year life, the total CO2 emissions associated with generating 1 kWh of electricity add up to 44 gCO2 per kWh, which is nearly 21 times lower than oil and 20 times lower than coal. Similarly, for a wind turbine with over a 20-year lifespan, the total CO2 emissions incurred by generating 1 kWh of electricity is 11, which is 88 times lower than oil and 86 times lower than coal.
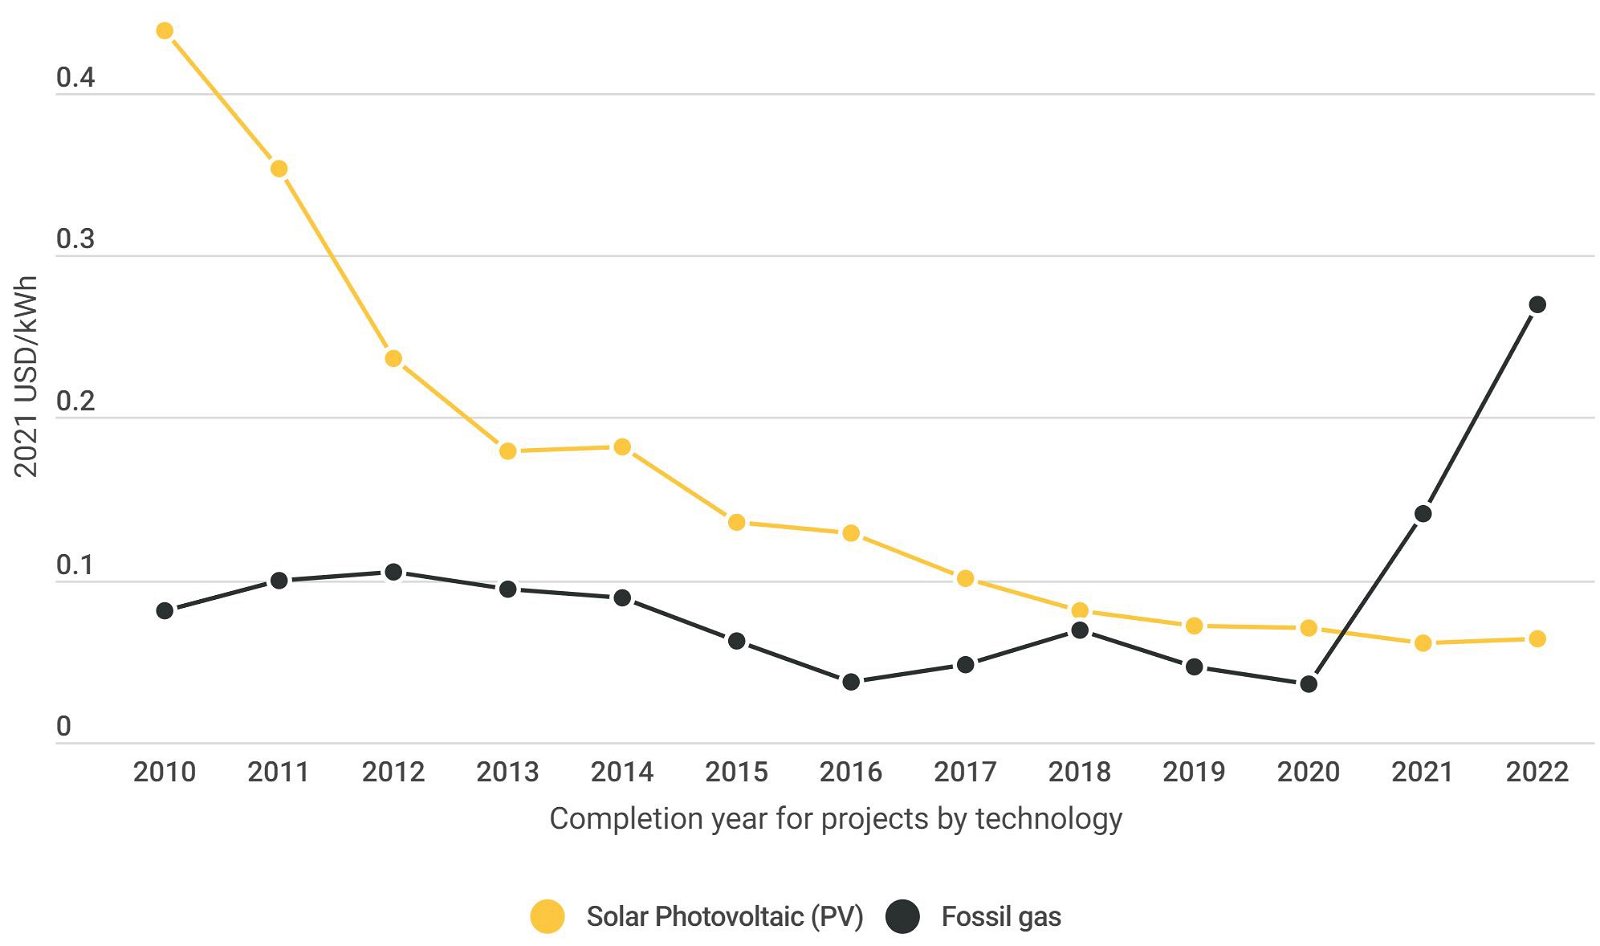
Renewable energy technologies are not carbon-free. However, they remain a smart initiative for tracking net-zero emissions by 2050. Additionally, renewable energy products are affordable compared to fossil fuel-based energy products. Excessive costs for coal and fossil gas in 2021 and 2022 will also significantly reduce the competitiveness of fossil fuels and increase demand for solar and wind energy4. For instance, new fossil gas generation in Europe will become increasingly unprofitable over time due to an exceptional rise in gas prices, raising the danger of stranded assets.
Figure 2. Utility-scale solar PV in Europe becomes clearly cost-competitive with fuel and CO2 costs
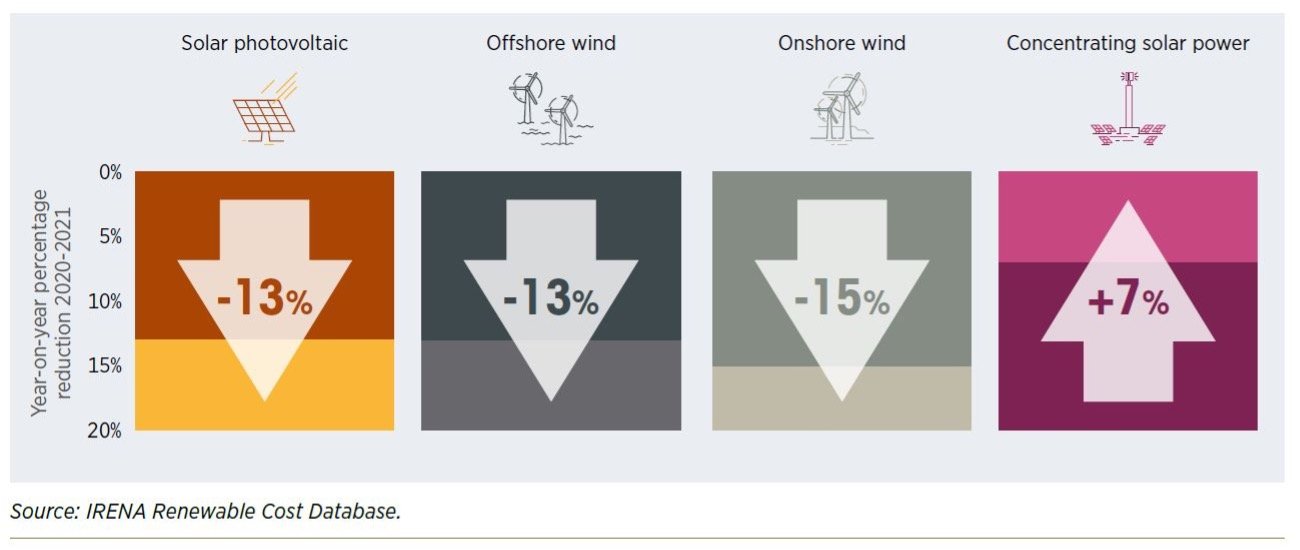
Also, according to the IRENA Renewable Cost Database displayed below (see Figure 3), the levelized cost of electricity (LCOE) of Solar PV and Offshore wind has decreased by 13% and 15%, respectively, in 2021 compared to 20203. Similarly, though CSP has climbed by 7% in 2021 compared to 2020, it's still well below 4% of its cost in 20102.
Figure 3. Global LCOE from newly commissioned utility-scale solar and wind power technologies, 2020-2021
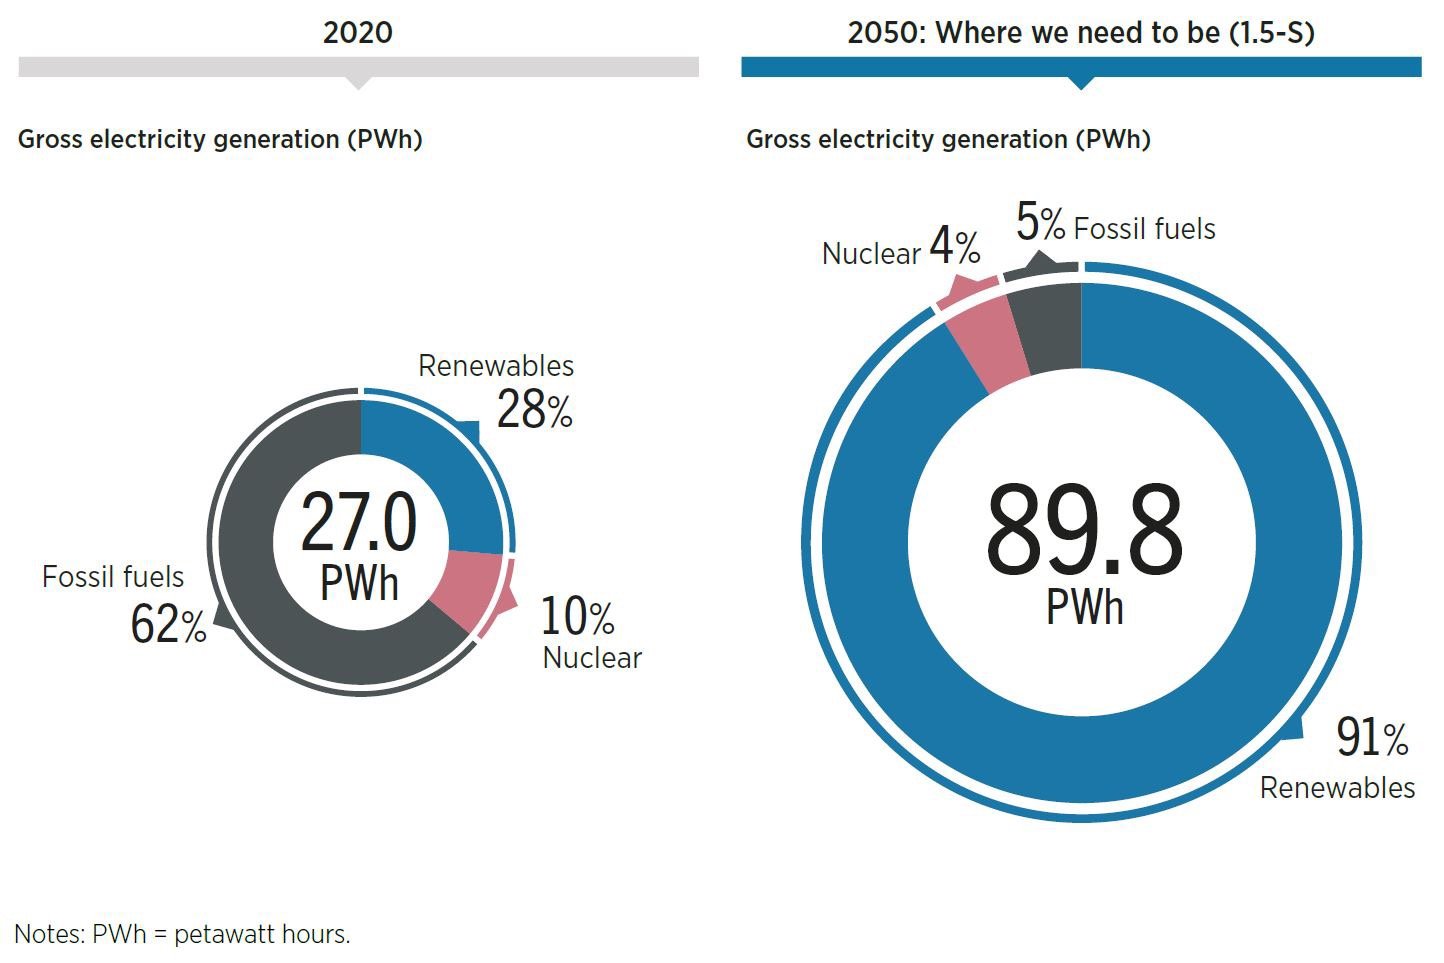
Therefore, renewable energy products need to be accelerated to minimize CO2 by 2050 as rapidly as possible given their incredibly low CO2 emission and low price compared to fossil fuels. The quantity of power produced will need to more than triple between 2020 and 2050, with renewable energy sources contributing 91% of the world's electricity supply, up from 28% in 2020 (see Figure 4). Over the next ten years, there will be a sharp decline in the amount of power generated from coal and oil, which will then be totally phased out by the middle of the century. Nuclear energy will supply 4% of the overall electrical needs, while natural gas will supply 5%5. Particularly in the areas of transportation and heating, the usage of electric technologies for end-use applications is growing. This change is marked by an essential synergy between more accessible renewable power technologies.
Figure 4. Power generation by 2020 and its scenario for 2050
In conclusion, fossil fuels such as coal, oil and gas require hundreds of millions of years to form. When fossil fuels are used for energy production, they release dangerous GHG gases such as CO2 (UN, n.d.), which remain in the atmosphere for 300 to 1000 years1. Burning fossil fuels produces more GHG than producing energy products from renewable sources.
According to Figure 1, for a 30-year solar system, the total carbon dioxide emission associated with the production of 1 kWh of electricity is 44 gCO2e/kWh, which is almost 21 times less than oil and 20 times less than coal6. The carbon dioxide emissions of a wind turbine with a lifetime of more than 20 years are respectively 11 gCO2e/kWh of electricity production, which is 88 times less than oil and 86 times less than coal3.
Therefore, the adoption of renewable energy products should be accelerated to minimize carbon dioxide emissions as soon as possible until 2050, because its CO2 emission is incredibly low and is the price compared to fossil fuels. Between 2020 and 2050, the amount of electricity produced must more than triple, and renewable energy sources will account for 91 percent of the world's electricity supply, compared to 28 percent in 2020. Over the next ten years, electricity production will decline sharply as well as electricity generated from coal and oil, which will then be completely phased out by mid-century4.
illuminem Voices is a democratic space presenting the thoughts and opinions of leading Energy & Sustainability writers, their opinions do not necessarily represent those of illuminem.
References:
Thomas Vogel

Renewables · Corporate Sustainability
illuminem briefings

Renewables · Energy Management & Efficiency
illuminem briefings

Renewables · Energy
Financial Times

Solar · Renewables
Financial Times

AI · Sustainable Investment
Euronews

Renewables · Energy