Extreme Heat: understand the metrics behind “felt temperature”

· 10 min read
Although human bodies have the same physiologic mechanisms across the globe, today you can find numerous thermal indices that measure the complex conditions of heat exchange between the human body and its thermal environment. As heatwaves are becoming a permanent threat during the summer, it is important for citizens to understand what “felt temperature” exactly means, how it is measured and why such indices can helps employers and government authorities to understand our bodies’ limits when it comes to heat load and use the index to set boundaries.
Before getting to felt temperature, it is important to understand how standard weather forecasts measure the temperature of the ambient air. To respect absolute standard conditions, and to deduce isothermal maps (lines of equal temperature), the thermometer is always in the same environment. It is placed in a weather shelter, as neutral as possible, painted white and where it is protected from bad weather (snow, hail, rain, dew etc.) as well as from solar and infrared radiation. To avoid any bias, the base of the shelter is installed on a natural ground with low vegetation and the temperature sensor is placed at about 1.50 metres from the ground. Meteorologists thus have at their disposal the minimum (measured at 6 p.m.), maximum (measured at 6 a.m.) and average temperature recorded over the last 24 hours.
So now… What exactly does “felt temperature” mean? What is the difference from the above notion? What differentiates each index from the other? What are the components that are taken into account for modelling such a subjective notion?
The concept of apparent temperature historically emerged in 1939 in the United States during Paul Siple and Charles Passel’s expedition to Antarctica. The idea was to demonstate that cold is felt more violently when there are strong winds. This principle was studied by scientists from 2001 onwards and an index was developed to highlight this phenomenon, which the meteorologist Pascal Yiacouvakis, sums up as: “The reality is not that it’s colder, but it’s that you lose more heat due to the wind.”.
The Wind Chill index is the lowering of body temperature due to the passing-flow of lower-temperature air. Wind chill numbers are always lower than the air temperature for values where the formula is valid. When the apparent temperature is higher than the air temperature, the heat index is used instead.
Indeed, during summer “felt temperature” is often different than that of air temperature. Mainly because humidity amplifies our feeling of heat. To maintain a temperature of 37°C, the body evacuates sweat through the pores of the skin. When this evaporates, it cools the body. A well-oiled mechanism that jams when the humidity level rises. The more humid the air is, the more difficult evaporation becomes. After 90% humidity, the evaporation of sweat even becomes impossible. Sweat sticks to the skin and the body is no longer able to cool itself properly. The heat felt then increases. This is one of the reasons why the heat can sometimes appear more unbearable at 28 degrees in a humid environment than at 35 degrees in a dry environment. Unlikely the WCI, the following indices can be used in a summer context.
The heat index combines air temperature and relative humidity, is measured in shaded areas, to posit a human-perceived equivalent temperature, as how hot it would feel if the humidity were some other value in the shade. For example, when the temperature is 32 °C (90 °F) with 70% relative humidity, the heat index is 41 °C (106 °F). The result is also known as the “felt air temperature”, “apparent temperature”, “real feel” or “feels like”.
Commonly used in Canada, the Humidex combines similarly the effect of heat and humidity. The term Humidex was first coined in 1965. The humidex is a nominally dimensionless quantity based on the dew point (see table below, “point de rosee”). While both the humidex and the heat index are calculated using dew point, the humidex uses a dew point of 7 °C (45 °F) as a base, whereas the heat index uses a dew point base of 14 °C (57 °F).
Humidex Index, defined by Temperature and Dew Point.
Invented by Robert Steadman in 1984 and defined by the Australian Bureau of Meteorology, the apparent temperature is computed on the measured air temperature, wind speed, and relative humidity. The measure is most commonly applied to the perceived outdoor temperature.
It was first used during the 1950s as a component of a campaign to reduce heat-related illnesses in the training camps of the US Army and Marine Corps. The WBGT was then suggested by Yaglue and Minard in 1957. The computation of this index relies on four parameters – namely dry temperature, relative humidity, wind speed, and radiation heat – which presents a more complete approach compared to previous indices above.
The SET is defined by humidity, mean radiant temperature, and air velocity, while also considering the anticipated activity rate of the body and clothing levels. SET is essentially a comprehensive comfort index that endeavors to incorporate physical factors of thermal comfort as well as physiological considerations.
Close to the SET, the PMV proposed by Fanger, predicts the mean value for a large group of individuals by using four environmental parameters – dry temperature, radiation temperature, wind speed, and relative humidity – and two human parameters (clothing insulation and metabolic rate).
The PPD is calculated based on PMV and its value ranges from 0 to 100. PMV and PPD are often used as the indices for assessing global thermal comfort in buildings which have mechanical cooling.
Created in the 1990s by Joel N. Myers, Michael A. Steinberg, Joseph Sobel, Elliot Abrams and Evan Myers, this index takes into account humidity, cloud cover, winds, sun intensity and angle of the sun. Humidity is a large contributor to determining the RealFeel, but the time of the day also is important, due to the angle of the sun.
Vulnerability is a slighly different concept than apparent temperature and is rather designed for systems rather than individuals. The Intergovernmental Panel on Climate Change (IPCC) has given a general definition as: “The propensity or predisposition to be adversely affected”. Cities, for example, are particularly vulnerable to extreme heat due to the trapping of heat in artificial surfaces which leads to the Urban Heat Island effect.
Here is a list of the components of Vulnerability based on the IPCC’s framework:
Proposed in 2009 within the framework of the International Society of Biometeorology (ISB) by leading experts in human thermophysiology, physiological modelling, meteorology and climatology, the UTCI is used mainly in Europe. Perhaps the most familiar application of the UTCI is the temperature given by TV weathermen and women when they say that, “even though the dry bulb temperature outside is a certain value, the temperature actually “feels like” something higher or lower”. This index takes into account the air temperature, solar radiation, relative humidity, and wind speed. UTCI also uses variables in a human energy balance model to give a temperature value that is indicative of the heat stress or cold stress felt outdoors.
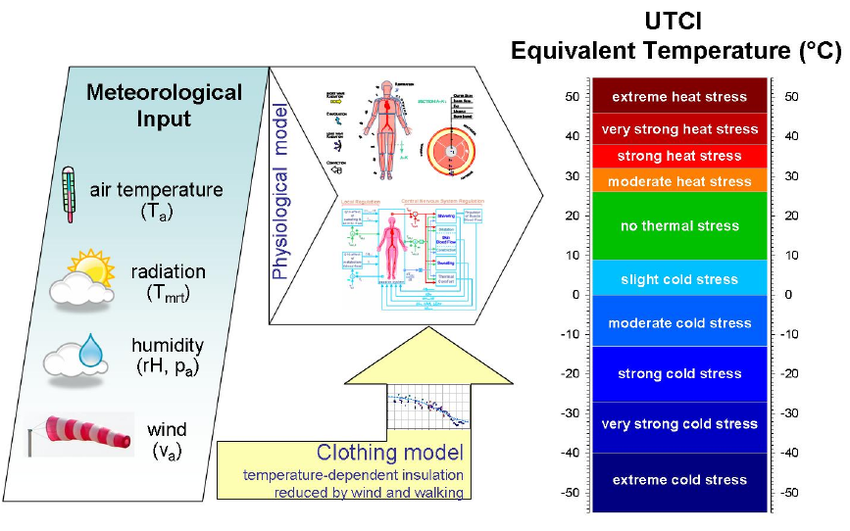
Heat stress is our body’s reaction to extreme weather conditions. In the case of heat, the thermal comfort zone for most people is between 20°C and 27°C, with a humidity level of 35% to 60%. If the body is no longer able to manage heat, it will exceed the threshold of disturbance when the actual or perceived temperature rises above the body’s comfort zone. The various index presented above can be used as a guide for employers to set boundaries in the workplace by taking the body’s limits into account when it comes to heat loads. You can find below some examples of indices applications.
The American Conference of Governmental Industrial Hygienists published exposure limit values that have been adopted by many governments for use in the workplace. The process used to determine the WBGT is described in ISO 7243, Hot Environments – Estimation of Human Heat Stress in the Workplace, based on the WBGT index.
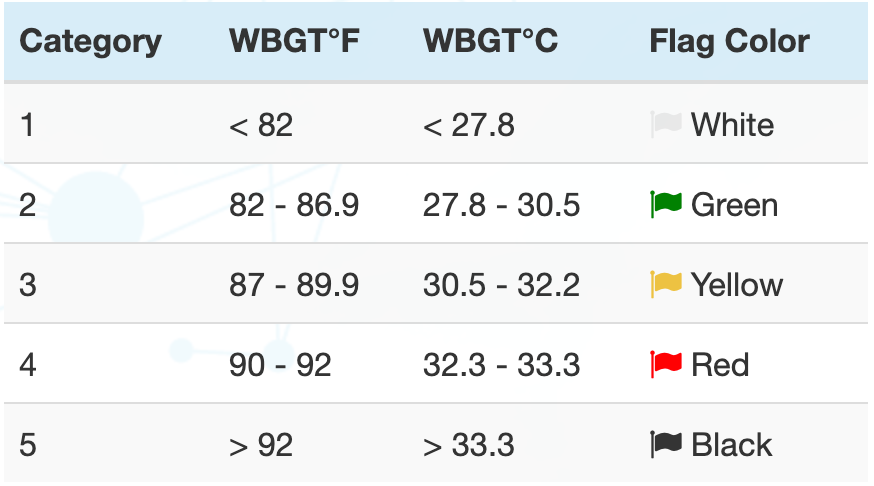
Similarly, in high-temperature areas, U.S. military bases (as well as other organizations) hoist a flag to indicate the level of danger due to heat stress. The flag threshold temperatures are based on the WBGT. This indicator is particularly applicable to outdoor workers.
With the apparation of engineering simulation tools in recent years, precision has been brought to the equation, enabling building companies to test and optimize any given environment for thermal comfort compliance easily.
According to the standards ASHRAE 55 and ISO 7730, all occupied areas in a space should be kept below 20% PPD in order to ensure thermal comfort. The indices PMV and PPD are widely used for the assessment of indoor environmental quality and energy-saving studies.
Also, the European Standard EN 16798 focuses on setting new rules and requirements for indoor environmental parameters for a thermal environment, indoor air quality, lighting, acoustics and explains how to use these parameters for building system design and energy performance calculations.
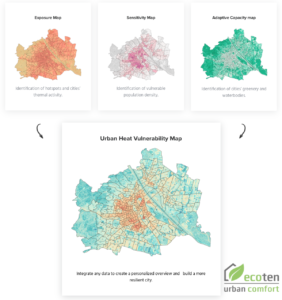
ECOTEN urban comfort produced the UHVI to conduct Urban Heat Vulnerability Assessments of cities. This framework is proven to be very relevant since this index has recently been recommended by the Joint Research Center of the European Commision for cities to “highlight areas where people are most vulnerable to heat and inform governments’ plans to protect people’s health more effectively”.
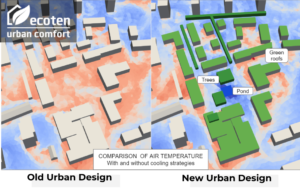
ECOTEN also uses the UTCI to run Urban Microclimate Simulations and compare the impact of urban projects on the thermal comfort of pedestrians in cities. ECOTEN is using this powerful framework because it is universally valid and can be applied to all climates, all regions, every season and every scale.
While extreme heat is expected to affect Europe this summer, other regions such as South Asia and the Persian Gulf are already experiencing temperatures beyond 40°C. According to Loughborough University (England) climatologist Tom Matthews, in areas heavily affected by extreme heat it will be increasingly difficult for humans to live there and they could even become uninhabitable in the future despite the body’s thermal efficiency.
It is essential to consider “felt temperature” since it appears to be a deeper indicator of the microclimate’s impact on our bodies. Considering the increasing frequency and intensity of extreme heat events that has been forecasted for the next years over the globe, it is crucial to bring more awareness about extreme heat management and extend the use of these index to more applications.
When heat strikes, please take care of yourself and protect your loved ones!
This article is also published on ECOTEN. Future Thought Leaders is a democratic space presenting the thoughts and opinions of rising Energy & Sustainability writers, their opinions do not necessarily represent those of illuminem.
illuminem briefings

Corporate Sustainability · Water
illuminem briefings

Ethical Governance · Environmental Sustainability
illuminem briefings

Carbon Capture & Storage · Carbon
Sustainable Views

Carbon Regulations · Carbon
Carbon Herald

Carbon Market · Carbon Regulations
Vatican News

Ethical Governance · Environmental Sustainability