Create a sustainable supply chain optimisation web app

· 28 min read
Summary
I. Introduction
II. Sustainable Supply Chain Optimization
1. The Challenges of Sustainability
2. The Support of Data Analytics
III. Introduction to VIKTOR
1. Key Features of VIKTOR
2. Benefits to Supply Chain Data Scientists
IV. Overview of the Sustainable Supply Chain Optimization App
1. Purpose and Functionality
2. Initial Step: Data Input
3. Second Step: Data Visualization
4. Third Step: Selecting the Objective Function
5. Final Step: Visualize the Results
V. Conclusion
Create a Sustainable Supply Chain Optimization Web App — (Image by Author)
Sustainable Supply Chain Optimization is an approach to network design combining cost-effectiveness with environmental responsibility.
It highlights the complexities that arise when businesses attempt to reconcile environmental considerations with profit objectives.
Supply Chain Network Design Problem: Costs vs. CO2 — (Image by Author)
This topic is increasingly relevant as organizations are under escalating pressure to reduce their carbon footprint by reshaping their supply chain networks.
As a Data Scientist, how can you help your organization reach its sustainability targets and improve its ESG score?
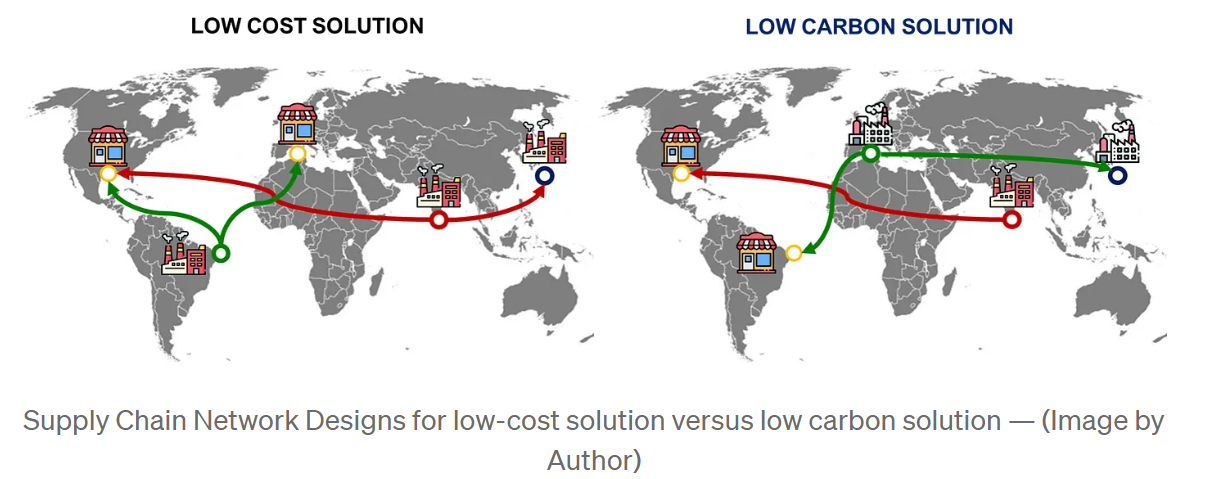
Unlike traditional models that often prioritize outsourcing to low-cost regions, there’s a noticeable shift towards localizing production in environmentally efficient facilities.
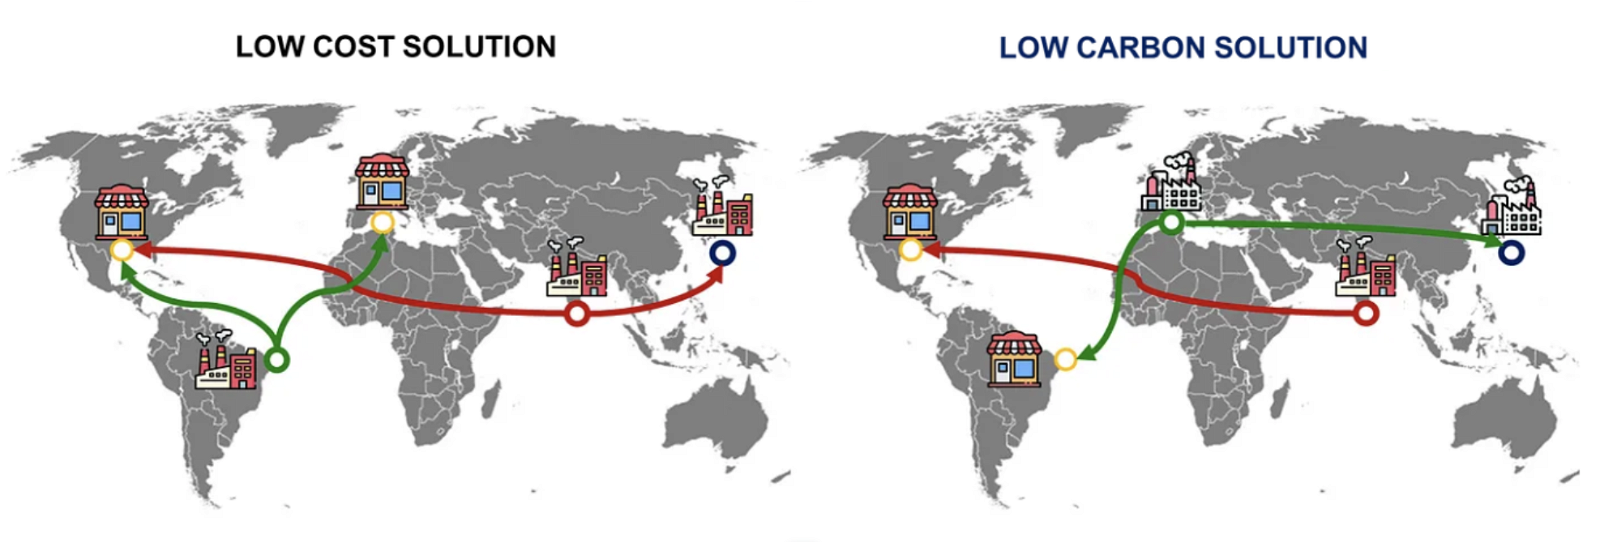
Supply Chain Network Designs for low-cost solution versus low carbon solution — (Image by Author)
However, balancing cost efficiency with CO2 emission reduction is a complex task that requires careful planning and strategic decision-making.
In this article, we introduce an application I developed using the VIKTOR platform, designed to facilitate data-driven decision-making for optimizing supply chain networks sustainably.
The idea is to leverage linear programming capabilities to address the challenge of meeting global demands while minimizing costs, CO2 emissions and resource consumption.
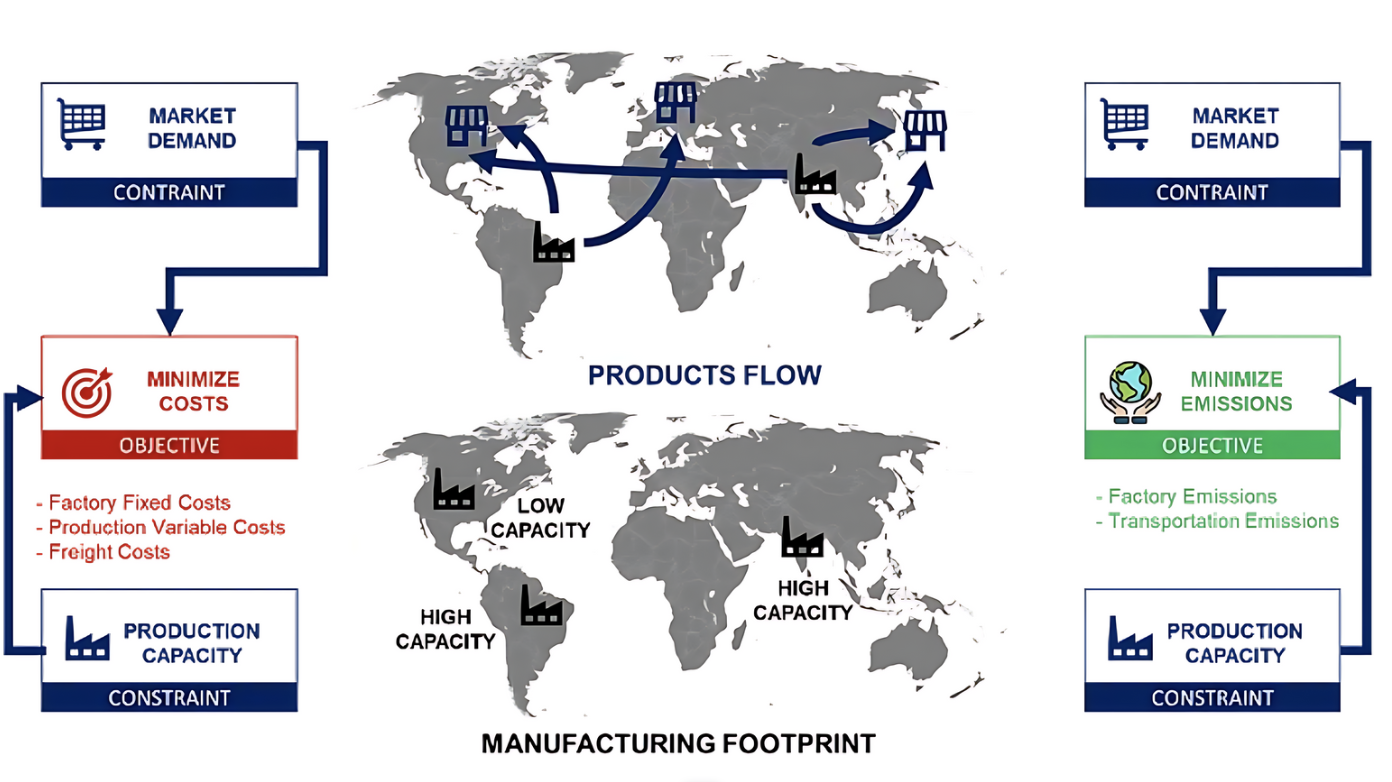
Supply Chain Network Design Problem — (Image by Author)
In the following sections, we will delve into sustainable supply chain optimization concepts and the need for integrating sustainability into strategic decisions.
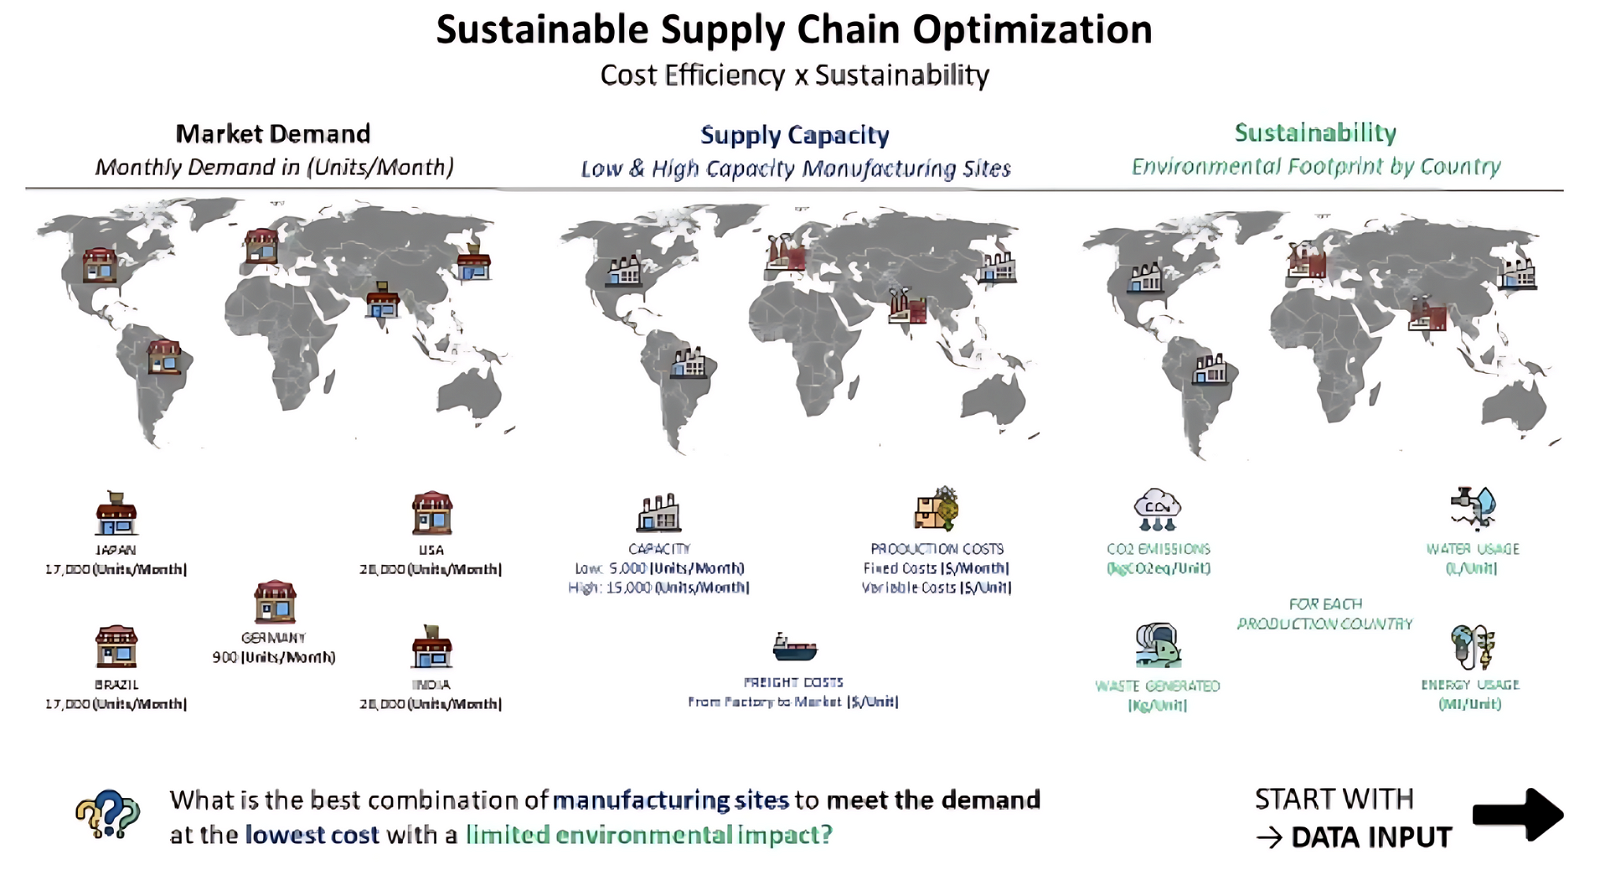
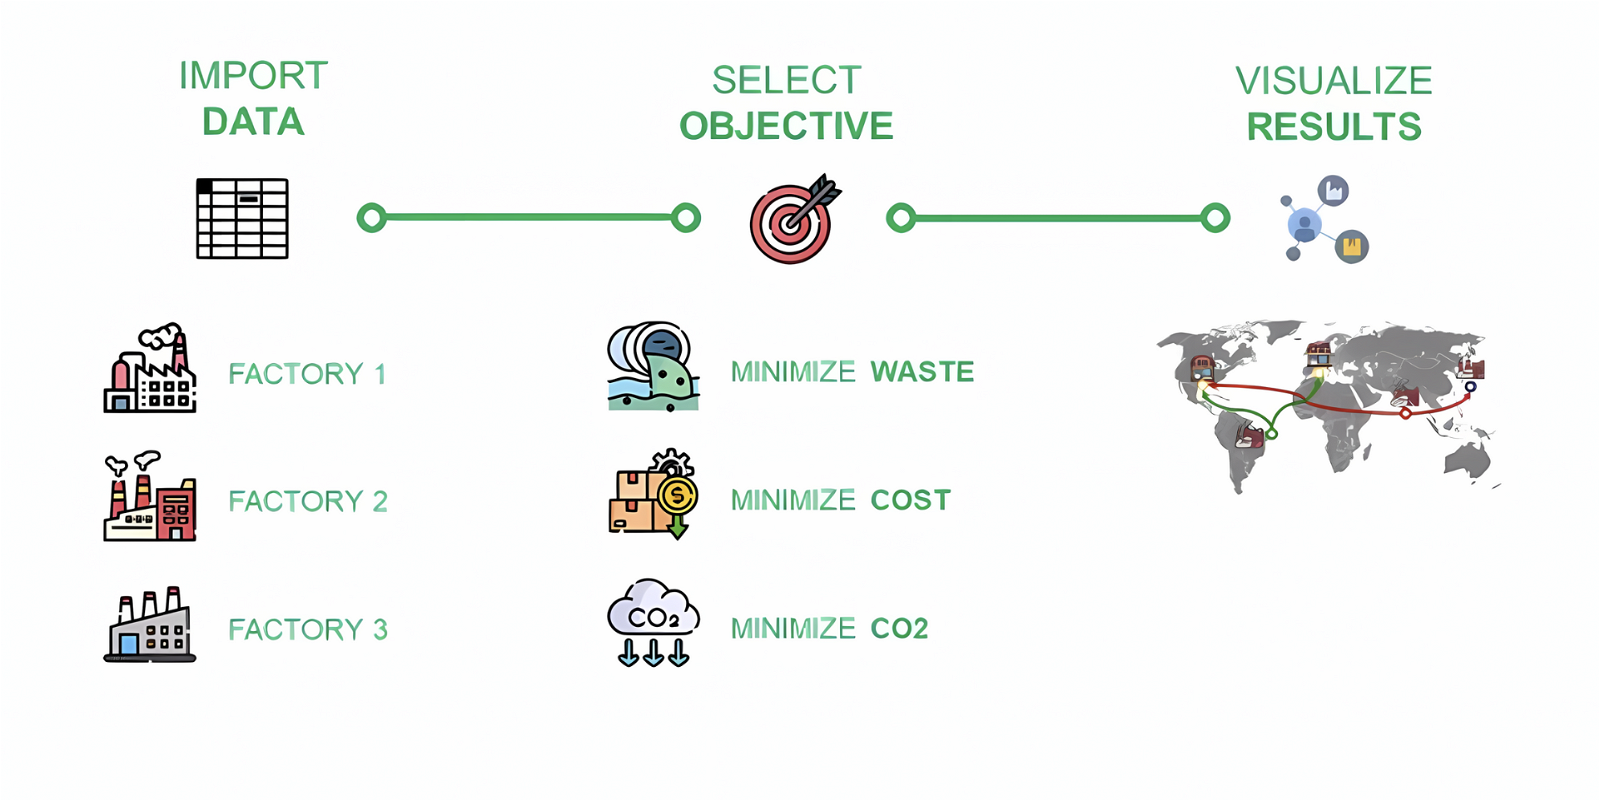
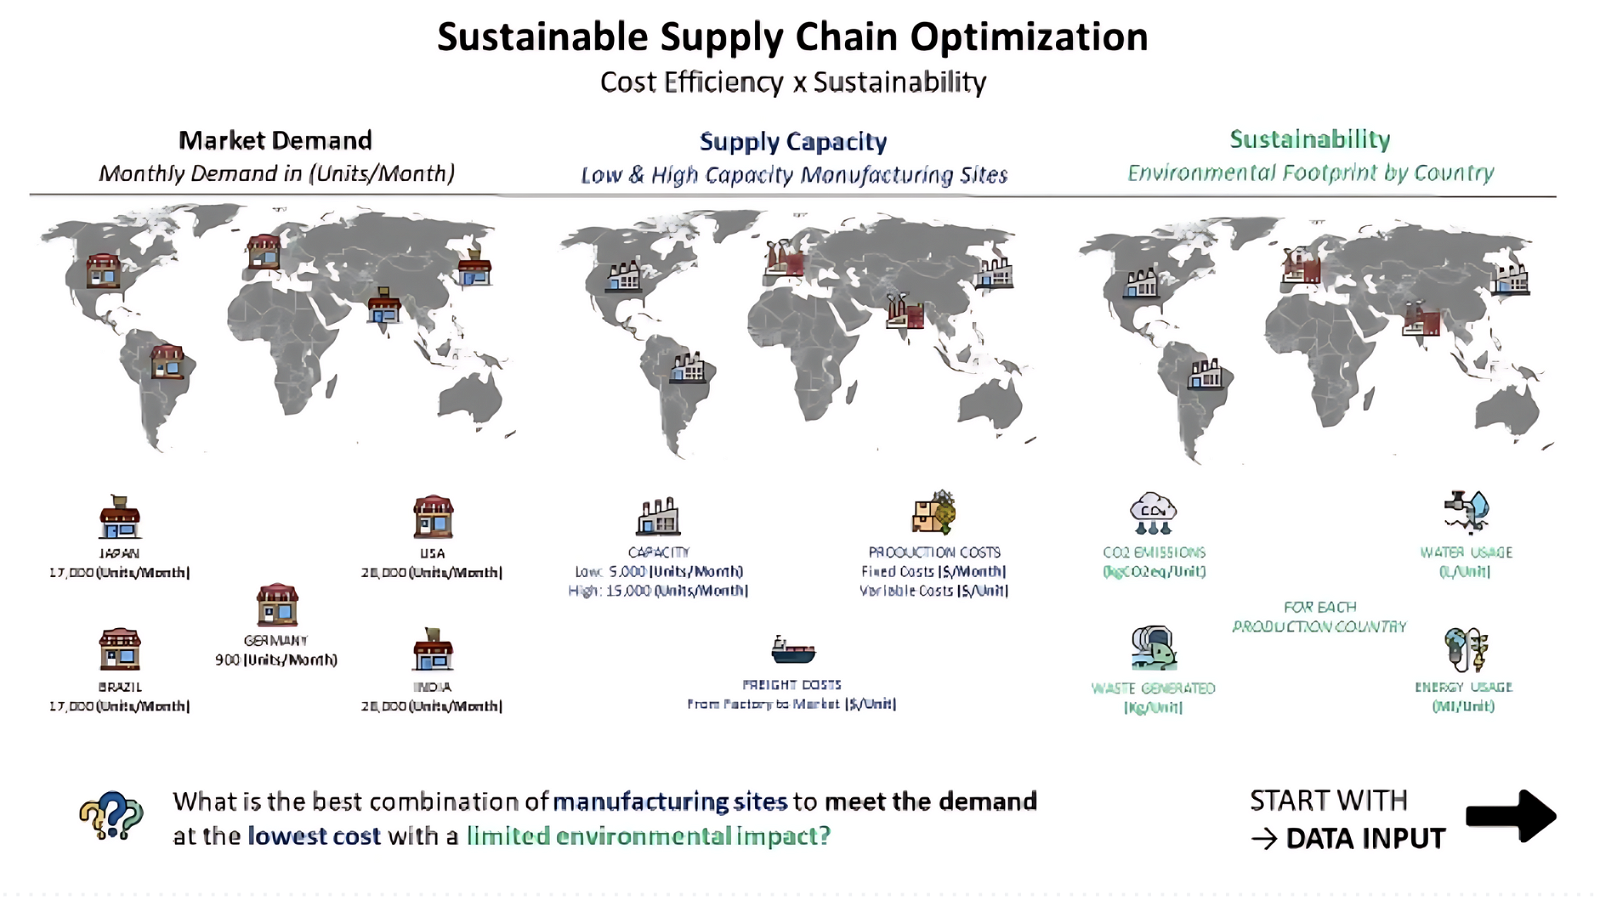
Introduction of the problem [App User Guide] — (Image by Author)
Additionally, you will get a comprehensive overview of the application using an actual example with the sample dataset included in the app.
This network design approach ties together environmental responsibility and supply chain efficiency.
It can be seen as a combination of two concepts I shared in previous articles
The transition towards sustainable supply chain optimization poses a unique set of challenges.
The core complexity lies in aligning efficiency and cost-effectiveness with environmental preservation.
Select the metric you want to minimize [App User Guide] — (Image by Author)
If you produce overseas in countries with low labour and production costs
If you produce in local green facilities
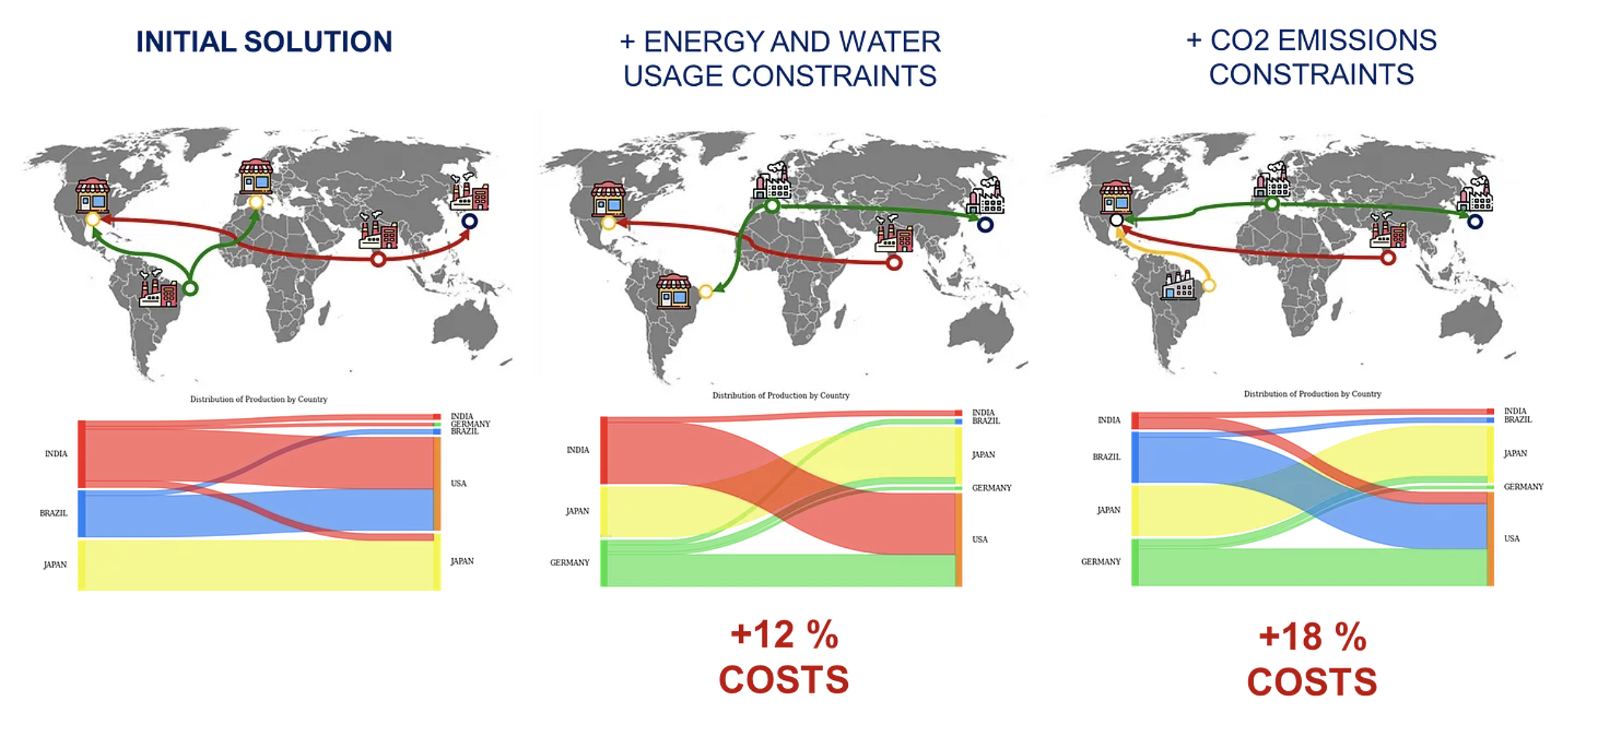
Several scenarios based on environmental constraints — (Image by Author)
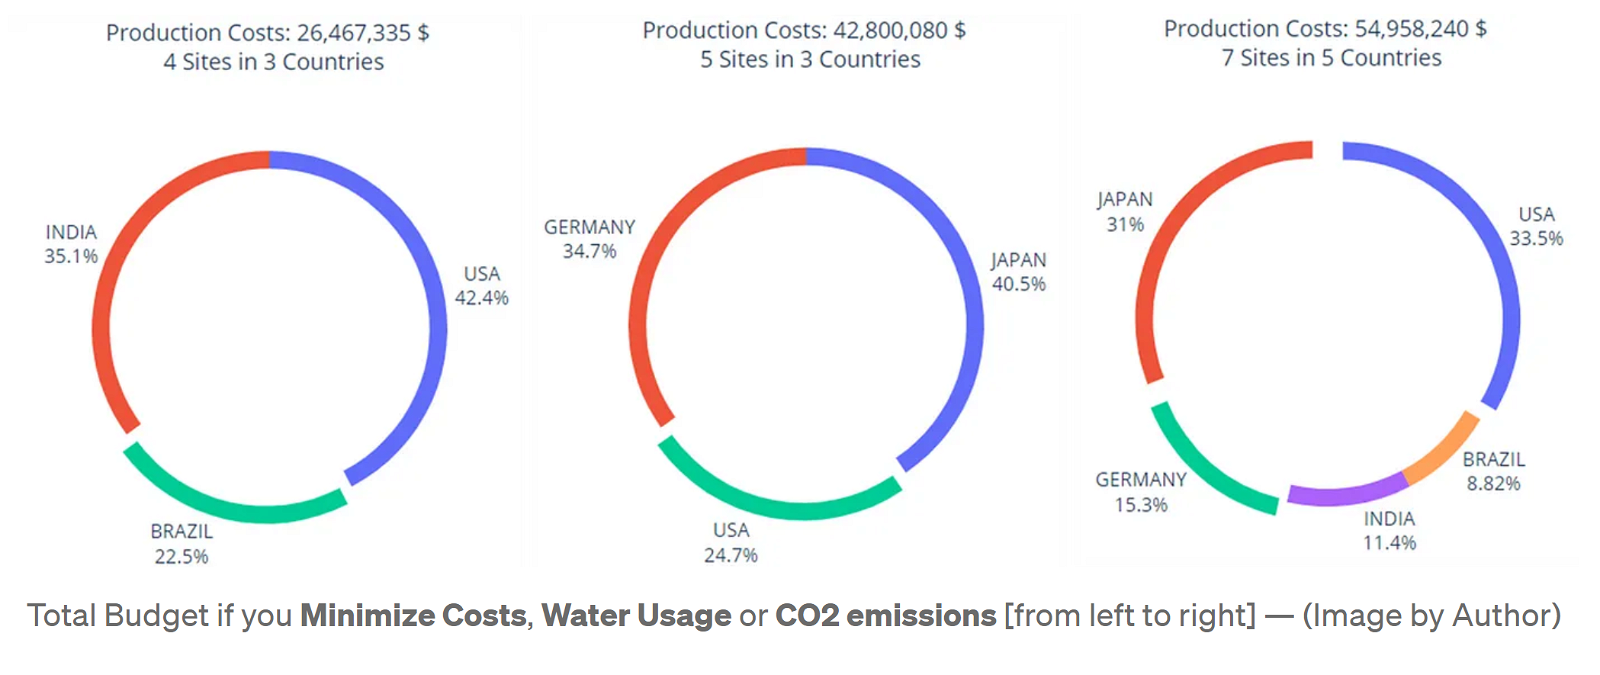
This application will provide you with different scenarios to help you to balance these different constraints.
In the previous articles, we discovered that linear programming can play a key role in optimizing the flows between factories and distribution centres.
These models can help you to fully automate in-depth analysis of cost parameters (fixed, variable and transportation) and footprint metrics (CO2, resources) to find the right balance that will satisfy business objectives.
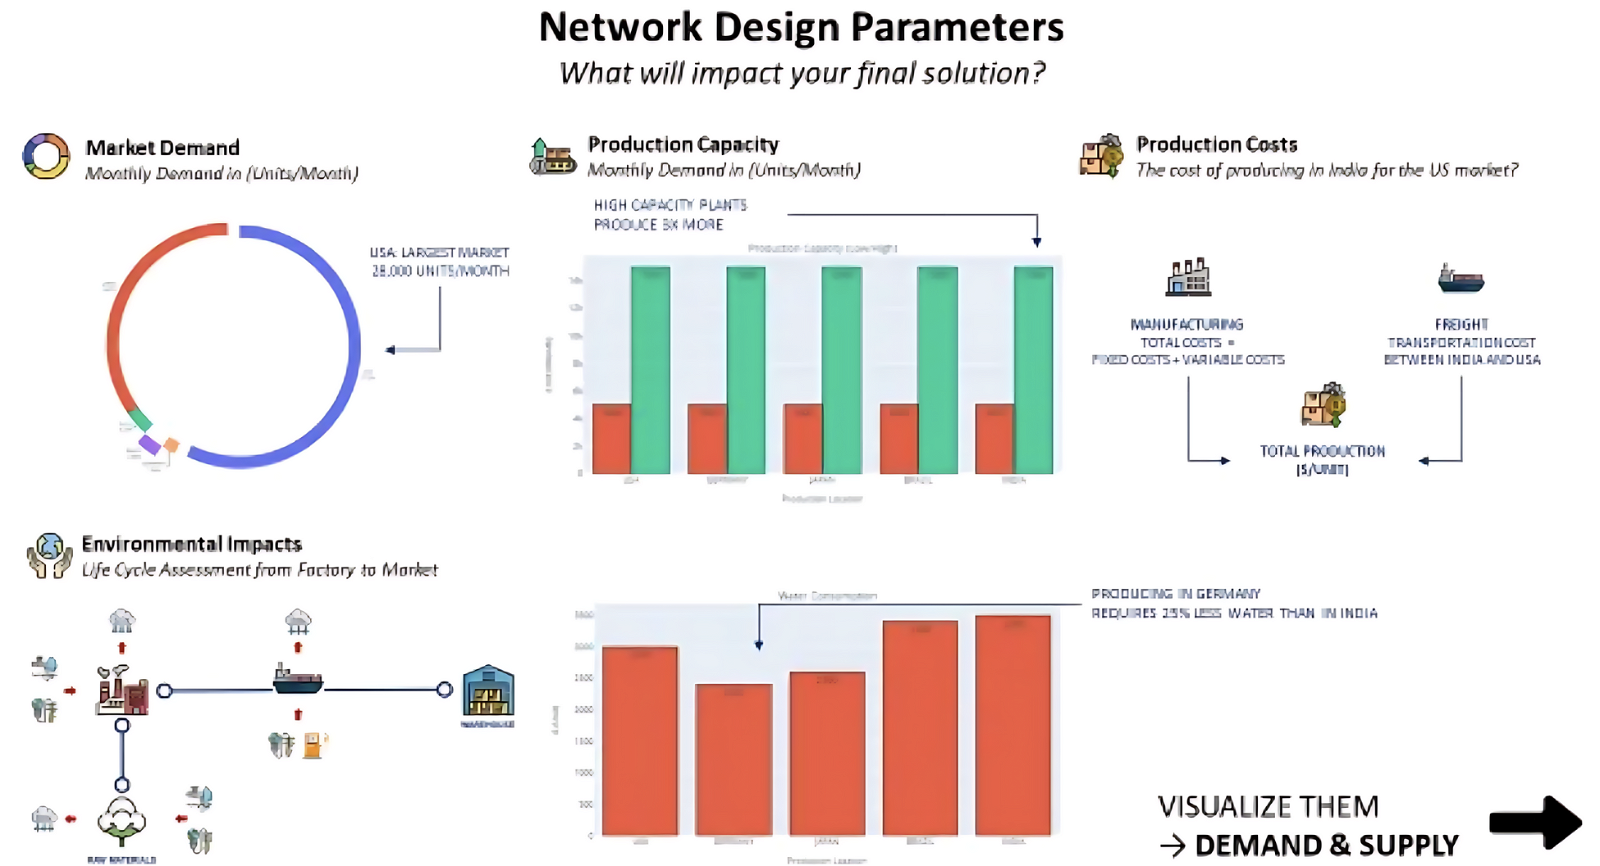
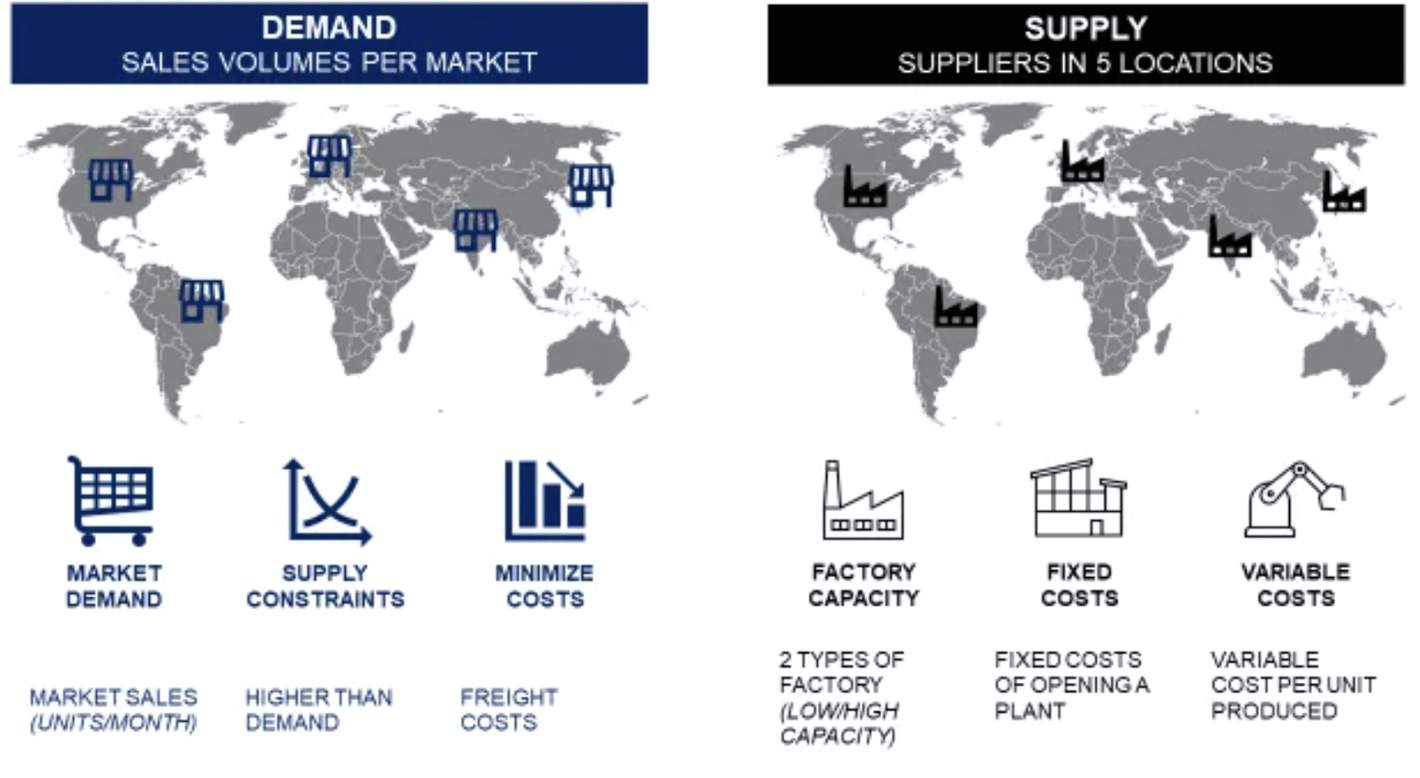
Parameters used in the sample dataset [App User Guide]— (Image by Author)
From an algorithmic point of view, you have a set of external parameters
You can also add a set of constraints,
The algorithm will then select a set of manufacturing locations to open
Based on the objective metric defined by the user, the model can propose the optimal set of boolean values that will minimize this metric.
VIKTOR is an intuitive platform designed to streamline the creation of engineering projects by offering powerful tools for quick deployments of Python-based algorithms.
VIKTOR stands out with its ability to facilitate rapid development, testing, and deployment of web applications.
My first application was a simple tool to automate ABC Analysis.
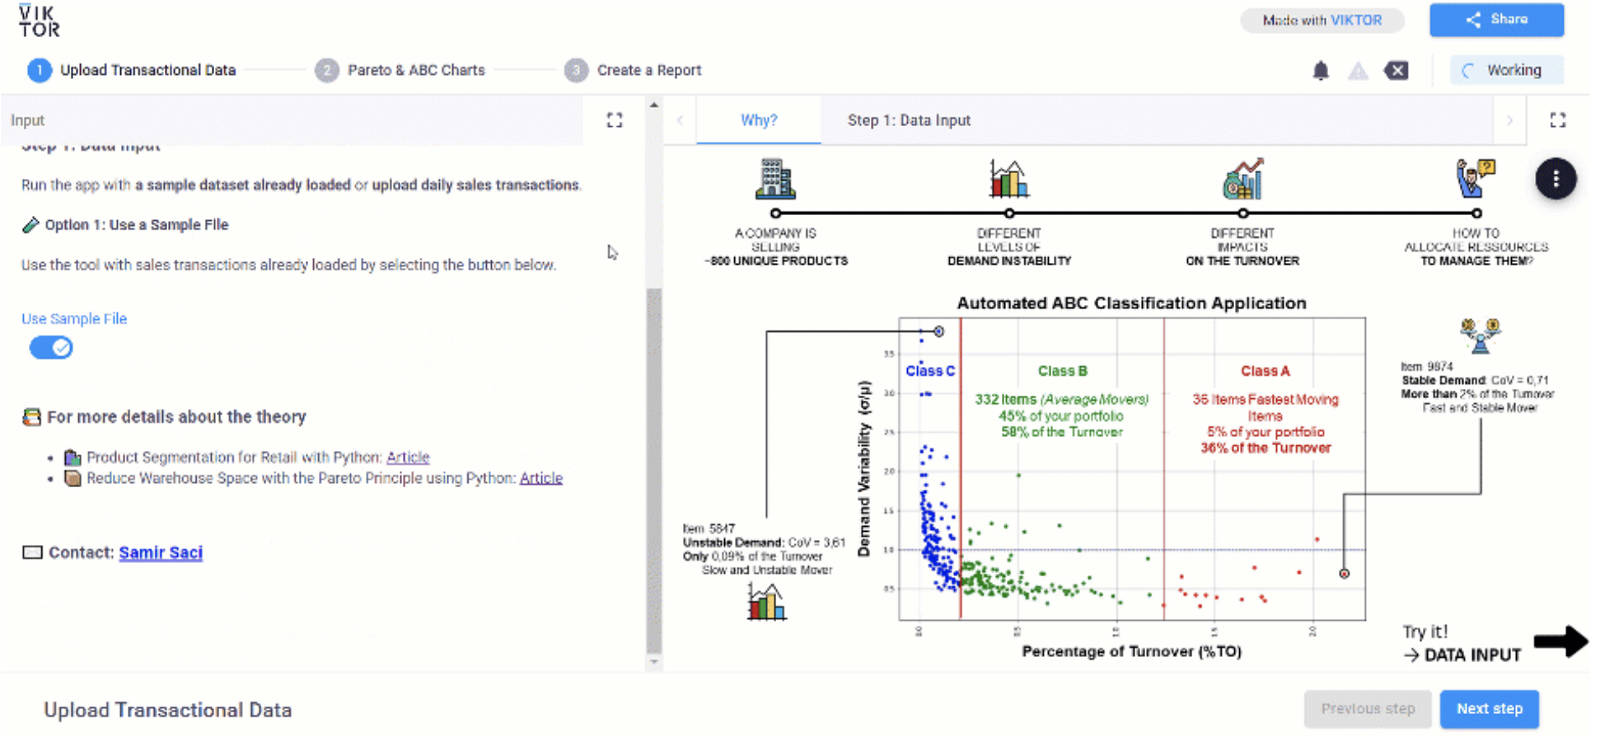
Screenshot of the ABC Analysis App — (Image by Author)
After several easy-to-follow steps, I deployed my Python model with an intuitive user web interface to show Pareto and ABC charts.
VIKTOR offers data scientists and analysts a user-friendly platform that integrates well with existing workflows and enhances productivity and efficiency.
For this application, I started with a model I shared in my Github (Link) related to the article about Supply Chain Optimization.
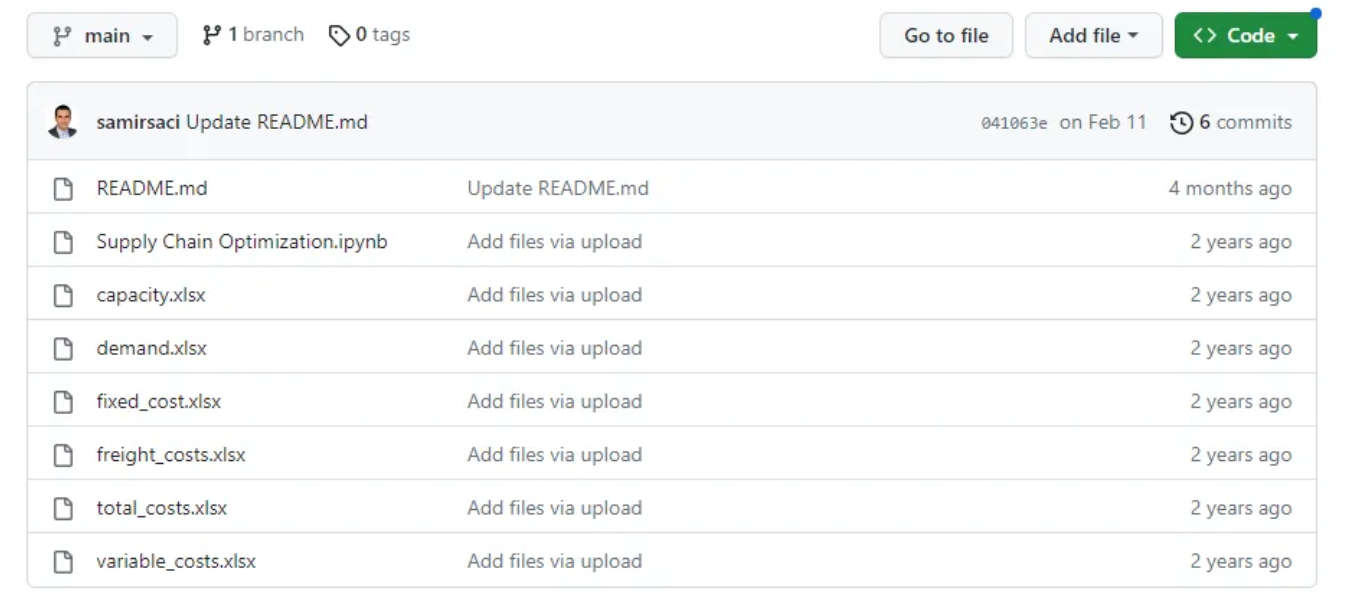
Supply Chain Optimization Simple Model — (Image by Author)
In the tutorial “Getting Started” (documentation), you can find all the different steps needed to deploy a simple app that can
Now, I can share this model easily with users who do not have programming skills to run a Python script.
For more information, have a look at the official VIKTOR Documentation.
The primary objective is to provide an interactive platform for supply chain engineers to simulate and evaluate different supply chain network design strategies.
It takes a single Excel file with several sheets as input and provides access to the results of multiple simulation scenarios.
You can try it here
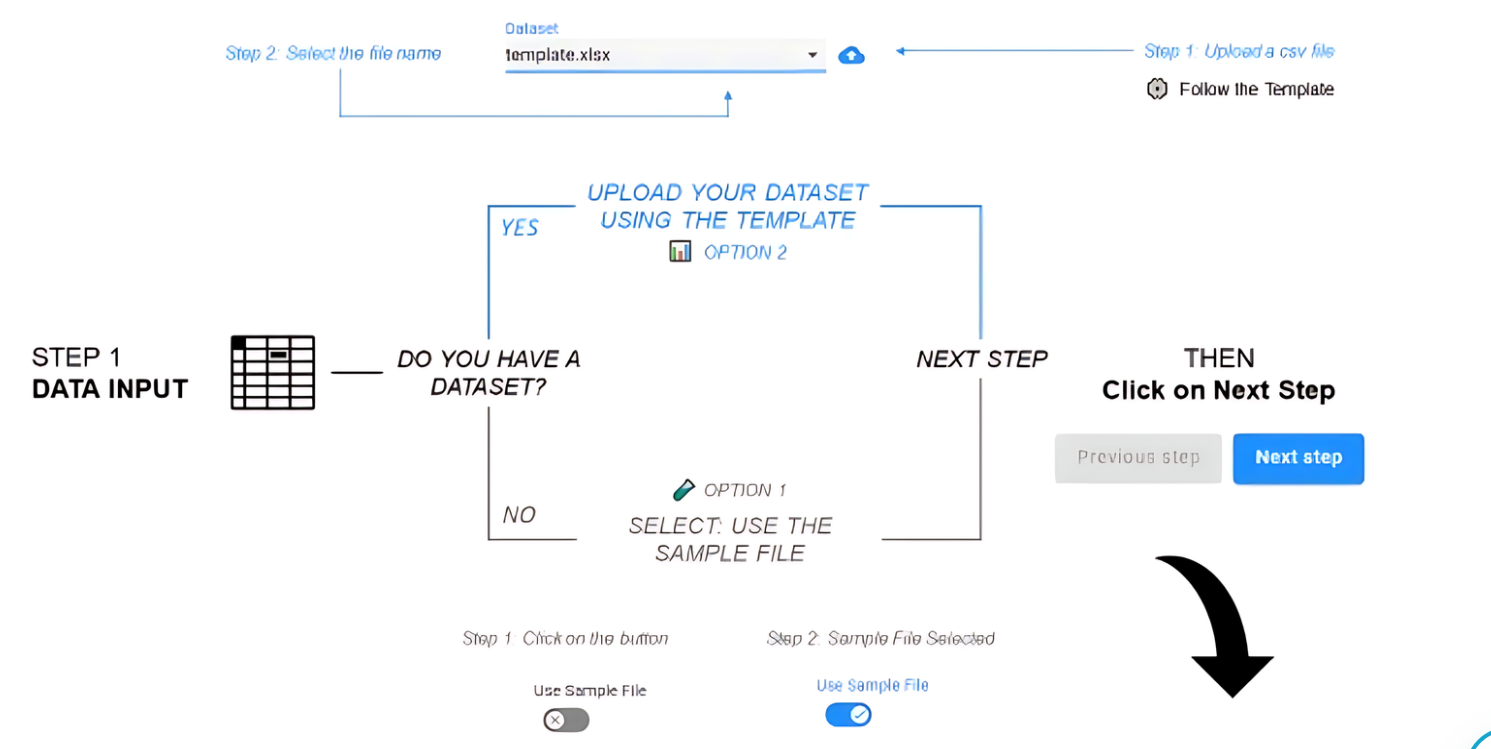
Users can input their data or use a pre-loaded dataset that includes information related to their market demand and manufacturing facilities.
Data Input [User Guide] — (Image by Author)
Users can input their data or use a pre-loaded dataset that includes information related to their market demand and manufacturing facilities.
Visualize the different parameters of your model based on the data included in the uploaded file.
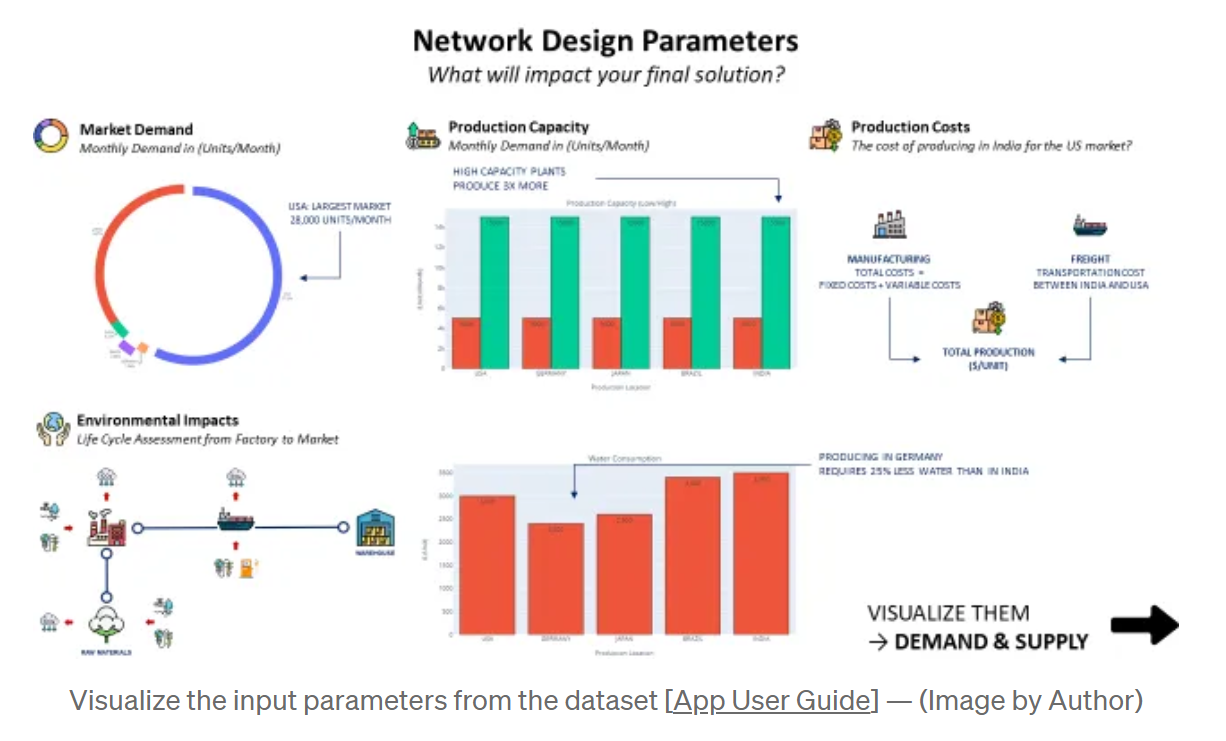
🛍️ Market Demand
In the location included in your dataset, you have customers (or stores) with a monthly demand in Units/Month.
🏭 Market Supply
In the location included in your dataset, you have potential manufacturing sites (low and high-capacity plants) with a maximum monthly production in Units/Month.
⚡ Energy Usage
For each production location, the energy consumed to produce a single unit (MJ/Unit).
🗑️ Waste Generation
For each production location, the amount of waste generated to produce a single unit (Kg/Unit).
🚰 Water Usage
For each production location, the amount of water used to produce a single unit (L/Unit).
🌲 CO2 Emissions
For each production location, the quantity of CO2 emitted per unit produced (Kg CO2eq/Unit).
There are multiple sources to gather these input parameters:
The tool will help you to decide where to set up factories to meet demand from all your markets considering transportation, production costs and environmental aspects.
This leads to informed strategic decisions that improve the efficiency and sustainability of your supply chain.
Users can select among four objective functions,
💰 Production Costs
Minimize the overall cost of producing and shipping products to different markets ($/Unit)
🚰 Water Usage
Minimize the amount of water used per unit produced (L/Unit)
⚡ Energy Usage
Minimize the amount of energy used per unit produced (MJ/Unit)
🌲 CO2 Emissions
Minimize the CO2 emissions per unit produced and delivered (kgCO2eq/Unit)
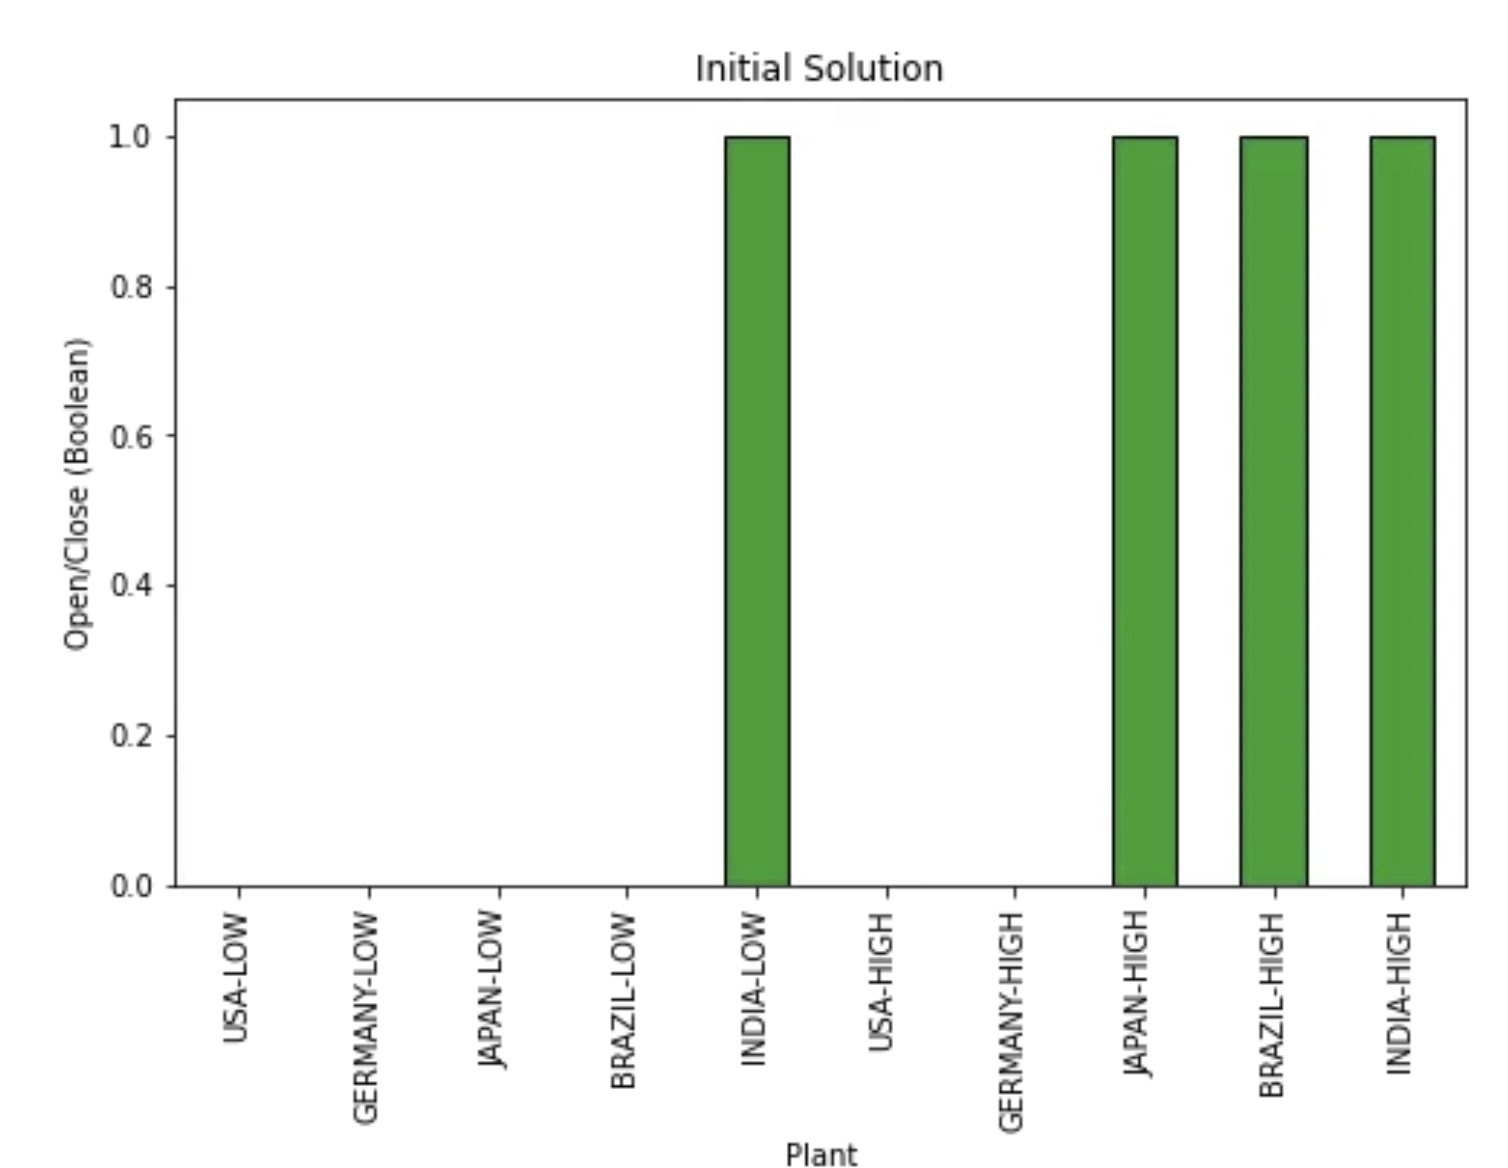
The results are automatically returned by the app,
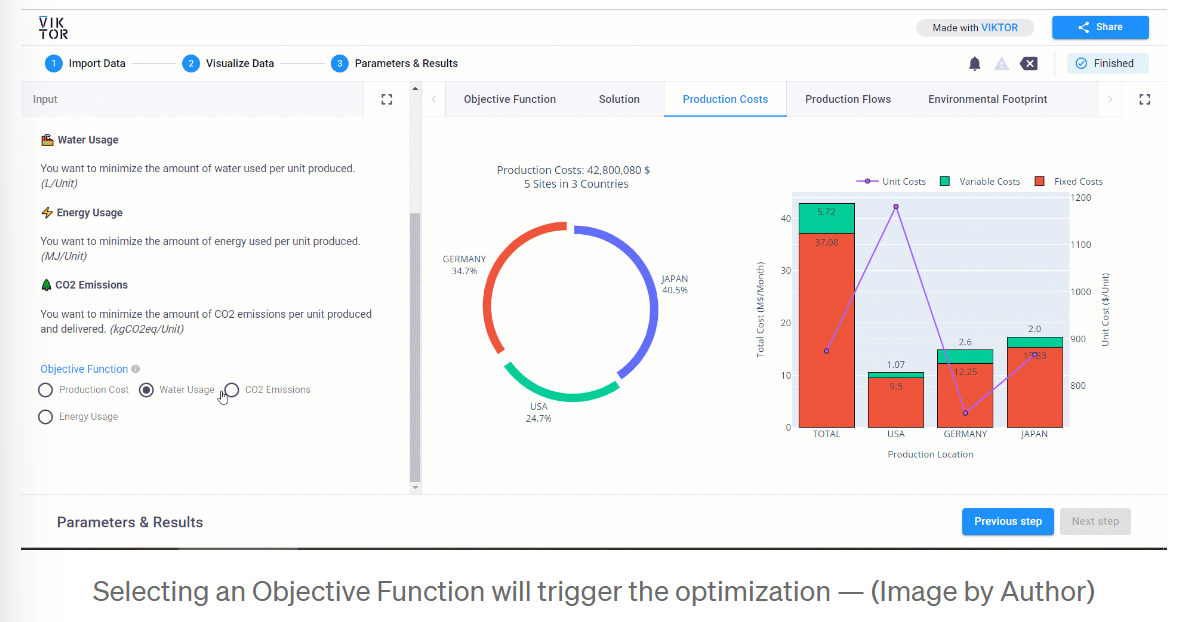
For each scenario, the application provides a comprehensive overview of the results using a detailed breakdown of costs and environmental impacts.
A Sankey chart is helping you to trace the flow of goods from production locations to their respective markets.
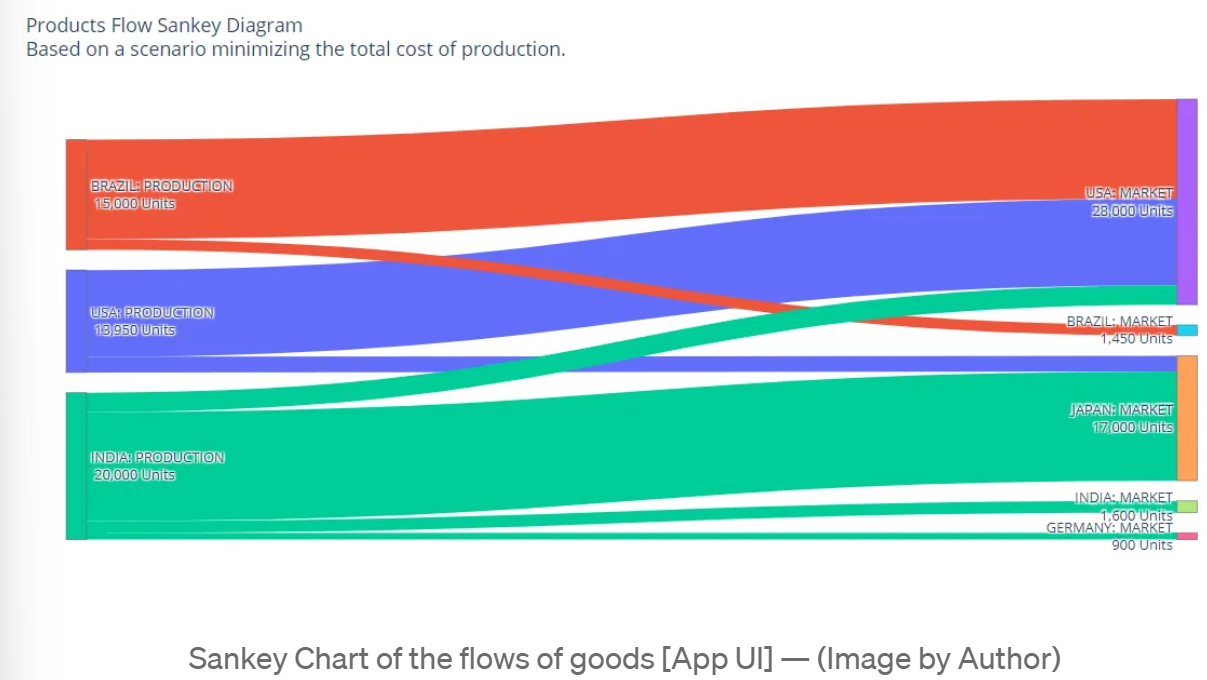
In the example above,
Decision-makers can take a hands-on approach to their network design.
Using data-fueled prescriptions, they will understand the impacts of each objective metric (CO2, Water, Energy, …).
For example, the visual above can raise the following questions
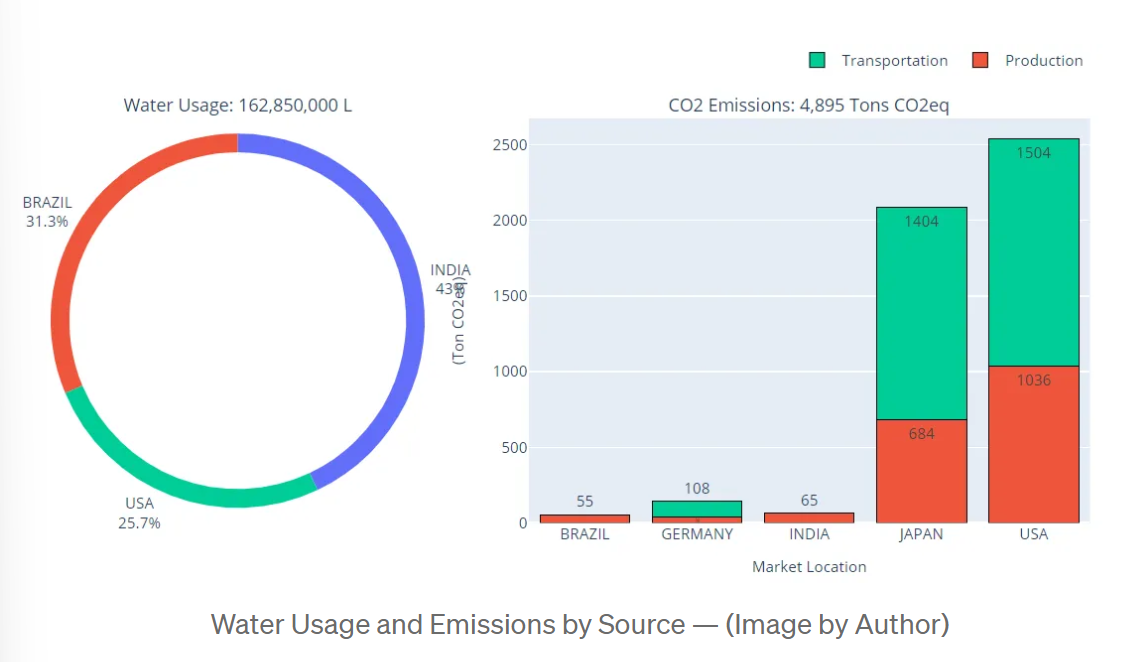
To answer question Q3, let's have a look at the visual below
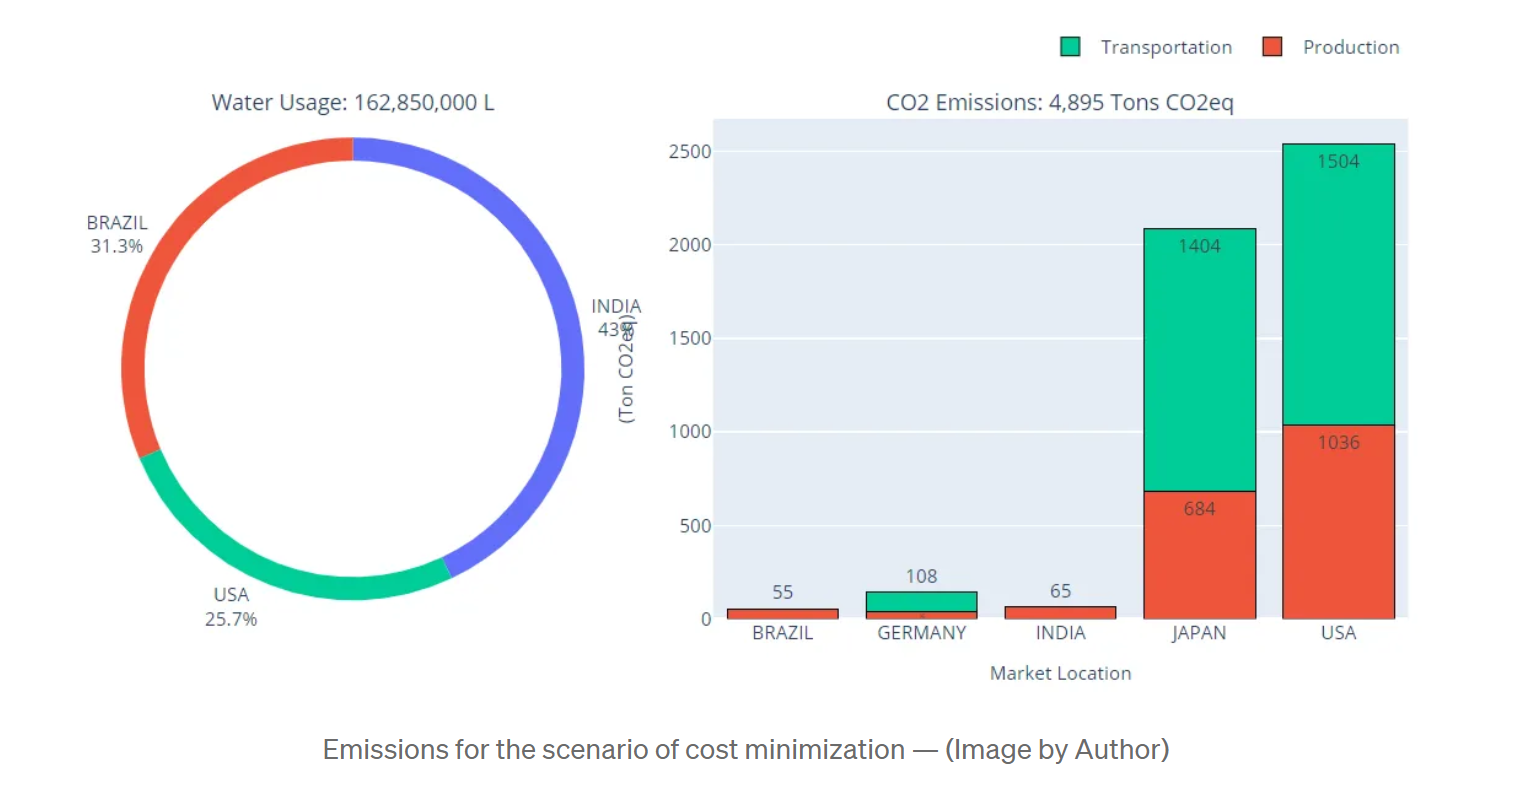
As we can see on the right, the majority of emissions per market is coming from the transportation of goods from manufacturing plants.
Thus, even with the greenest equipment in India, we would still have high emissions because of transportation.
Businesses need to respond more effectively to the growing environmental, social, and governance (ESG) demands from stakeholders and regulatory bodies.
This simple prototype, deployed using VIKTOR, can help to boost their transition towards green supply chains.
It can be easily improved by adding more advanced functionalities such as,
I invite you to explore this application, leveraging its capabilities to test different optimisation scenarios using your dataset.
This article is also published on the author's blog. illuminem Voices is a democratic space presenting the thoughts and opinions of leading Sustainability & Energy writers, their opinions do not necessarily represent those of illuminem.
David McEwen

Climate Change · ESG
illuminem briefings

ESG · Sustainable Finance
John L. Craig

Nature · Sustainable Finance
IEEFA

Sustainable Finance · ESG
ESG Today

Sustainable Finance · ESG
Sustainable Views

Sustainable Finance · ESG