Cracking the code: why energy models keep failing us
 Canva ProCanva Pro
· 8 min read
• Energy models have consistently underestimated solar growth, missing real-world cost reductions and advancements
• Inaccurate projections stem from ignoring learning rates, misrepresenting storage needs, and undervaluing carbon costs
• To improve models, incorporate realistic learning rates, account for energy storage, and reflect carbon damage
In 1995 I participated in a study trying to predict the amount of solar power deployed globally by 2010. In our most optimistic scenario, we predicted a cumulative amount of 11.3 GW in a time where there were only a few 100 MW of installed solar projects. Three years later, in 1998, the International Energy Agency (IEA) predicted that we would have 500 MW of installed solar power by 2010 and much later in 2007, Photon Consulting then predicted a volume of 13.4 GW.
We were all wrong.
Driven by supportive policies all over the world and Chinese investments in factories, solar power had grown up to 40GW by 2010.
“Prediction is very difficult, especially if it’s about the future”, as Niels Bohr acknowledged. But it is worthwhile to dissect the continuing failure of the energy modelling community to get close to actual outcomes. Many people have reported about the continuous underestimation of solar growth by the IEA, but none of them have been as prolific as Auke Hoekstra (Eindhoven University), who regularly produces graphs such as the one below in 2021.
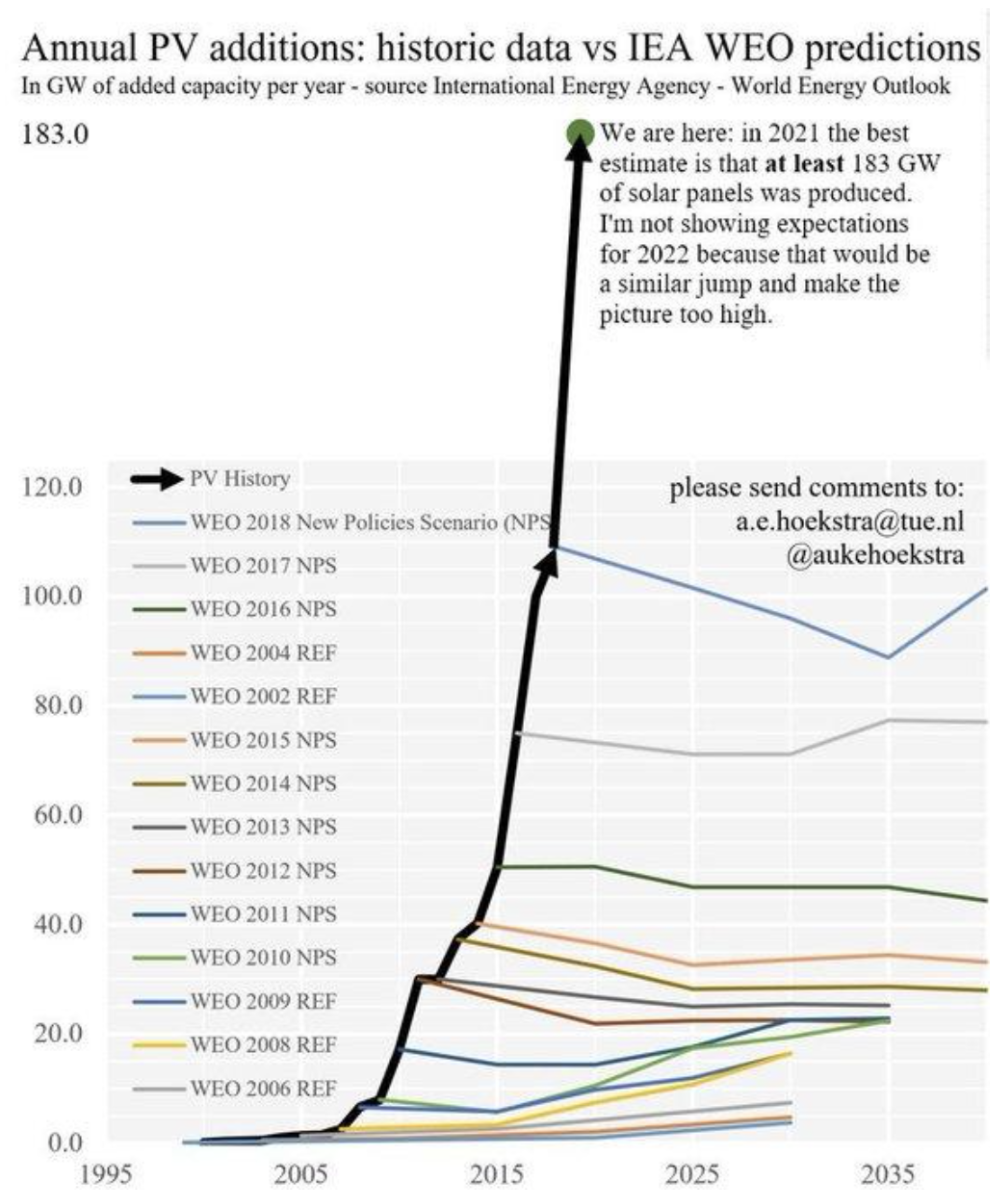
Figure 1. Historic growth of PV additions versus IEA WEO predictions
According to this graph, solar PV has grown exponentially year on year for decades, yet every year the IEA chose to model zero growth or even a declining growth rate going forward. It has been widely reported that many energy-economy models, not just by the IEA but even the Intergovernmental Panel on Climate Change, have historically underestimated deployment rates for renewable energy technologies and overestimated their costs.
So what is the cause of this disconnect? Two major reasons, overly conservative, invoke arbitrary estimations of cost reduction potential and arbitrary cost floors. In addition, a lot of wrong outcomes originate from underestimating energy storage in our energy system and misrepresenting carbon emission costs.
Most energy technologies follow a pattern of deployment that leads to lower costs, which itself leads to more deployment, and ever lower costs. This mechanism is called the learning rate, and is defined as the fractional reduction in cost for each doubling of cumulative production or capacity. Why does deployment lead to lower cost? A growing market enables manufacturing at scale, a better grip on the supply chain, as well as improvements in the conversion efficiencies of the technology. Wright’s law then predicts that costs drop as a power law of cumulative production, following the typical S-curve that has been observed with solar, wind and batteries recently.
What does this mean for solar PV? A recent analysis by Mengzhu Xiao et al comparing 22 mostly global scenario studies concluded that all studies show a decrease in levelised cost of electricity (LCOE) of solar PV, but at a much slower rate than in actual auctions, which reflect real-world costs. All studies but one (!) assume costs for 2050 higher than today’s auction’s value. In other words, planning agencies use costs for 2050 that have already been invalidated in today’s market.
The scenario studies are produced using Integrated Assessment Models (IAMs) that seek to represent global energy systems and their economic and environmental interconnections. However, most models assume that the costs and cost curves are exogenous, i.e. not dependent on what happens inside the model. They don’t incorporate learning rates, which for solar PV has been between 20% and 25% for decades. Literature has shown that most modern renewable energy technologies have higher learning rates than fossil fuel technologies. Nuclear power even has a negative learning rate due to increased safety demands after Chernobyl and Fukushima, making nuclear power more expensive now than 30 years ago. By not incorporating the concept of learning rates into the model, the outcomes will be skewed towards conventional energy solutions, with higher real costs as a result.
Rupert Way et al argue that most Integrated Assessment Models wrongly introduce cost floors for renewable energy technologies. Most models have built-in deployment rate limits and cost floors, i.e., fixed levels that costs are assumed to never fall below. These are introduced on an ad-hoc basis to prevent the model from projecting solutions in which key green technologies are deployed faster than is physically or socially deemed plausible. Since we don’t know exactly what these constraints are in real life, the choices are somewhat arbitrary. However, the historical record indicates that the constraints on key green technology deployment and costs used in IAMs have so far been much too conservative. The imposition of overly strong constraints is one of the reasons why most models have historically been wrong.
We have a lot more renewables in our system now than predicted in the past.
In our recent Dii paper “Energy storage, the new frontier” we found that most models do not account for the systemic role of energy storage. Energy storage is a crucial element of a functioning energy system and covers three main functions. Firstly, it addresses the mismatch between supply and demand. Secondly, it provides a buffer against energy supply disruption, contributing to energy security. A third driver for storage is commercial: prices fluctuate and traders, operators, buy fossil fuels when prices are low, store, and take advantage of price fluctuations.
Most energy is stored and transported as a molecule, amounting to 20.8% of all annual molecular energy demand in the world. 26.8% of oil, 20.6% of coal and 13% of annual natural gas demand is being stored. Electrochemical batteries and pumped hydro storage are 3,000 times smaller in volume and amount to a mere 0.03% of global energy storage.
We analysed several energy models projecting the make-up of a future clean energy system and concluded that most, if not all, underestimate the storage requirements to provide a functional energy system. Our future electricity system, which will cover half of all future energy use, cannot function based on the numbers provided in these models because there is insufficient consideration for flexibility and price stability provided by storage and transport of molecular energy in the system.
The actual costs of carbon emissions are never fully appreciated in Integrated Assessment Models. The way they try to calculate the so-called social cost of carbon nonetheless is by translating greenhouse gas emissions into climate change impacts and then calculating a monetary cost to those impacts in dollars per year. As well as changes in global temperature, IAMs account for changes to agricultural productivity, sea level rise, rainfall changes, extreme weather and risks to human health, to varying extents. Policy makers, especially in the US, use this social cost of carbon (SCC), which is defined as the marginal cost of emitting one extra tonne of carbon at any point in time, to evaluate whether a policy designed to curb climate change is justified. However, when the SCC is too low, the outcomes are dramatically skewed towards conventional energy solutions.
From a technological cost perspective, the 2018 IPCC report suggested that limiting global warming below 1.5°C requires technology costs around $135 to $5,500 in 2030 and $245 to $13,000 per tonne of CO2 in 2050. This is more than three times higher than for a 2°C limit. A study published in Nature in September 2022 estimated the social cost of carbon to be $185 per tonne of CO2 - 3.6 times higher than the U.S. government's then-current value of $51 per tonne. It should be noted that only 25% of global CO2 emissions are priced and that the current price in the European Emissions Trading System, the largest carbon market in the world, hovers around $70 per tonne.
In 2024, Adrien Bilal and Diego R. Känzig from Stanford University released a working paper that estimates that the macroeconomic damages from climate change are six times larger than previously thought. They find that 1°C warming reduces world GDP by 12%. The major cause of this are extreme climatic events, which strongly correlates with global temperature, much more than country-level temperature used in previous work, explaining the larger estimate. The authors find that this represents a social cost of carbon of $1,367 per ton, much higher than other estimates, or the price of EU carbon permits. According to the authors, in a business-as-usual scenario, global warming implies a 25% present welfare loss. This is comparable to the economic damage caused by the 1929 Great Depression but experienced permanently.
No model outcome comes anywhere close to this.
Integrated Assessment Models are useful tools to build energy scenarios and inform policy making. They are the best we have. However, as analysed above, most models are biased towards conventional solutions and produce outcomes that are more expensive and more harmful than could be achieved using lower emissions technologies. It is therefore imperative to correct common practice by making the following adjustments:
Only if we model correctly will we arrive at outcomes that make sense.
illuminem Voices is a democratic space presenting the thoughts and opinions of leading Sustainability & Energy writers, their opinions do not necessarily represent those of illuminem.
illuminem briefings

Energy Storage · Renewables
Yury Erofeev

Battery · Energy Storage
Diego Balverde

Energy Management & Efficiency · Energy Storage
The Guardian

Energy Storage · Battery
Euronews

Energy Transition · Energy Storage
Inside Climate News

Power Grid · Power & Utilities